EUR/USD bearish zigzag pattern has target at 1.20
-
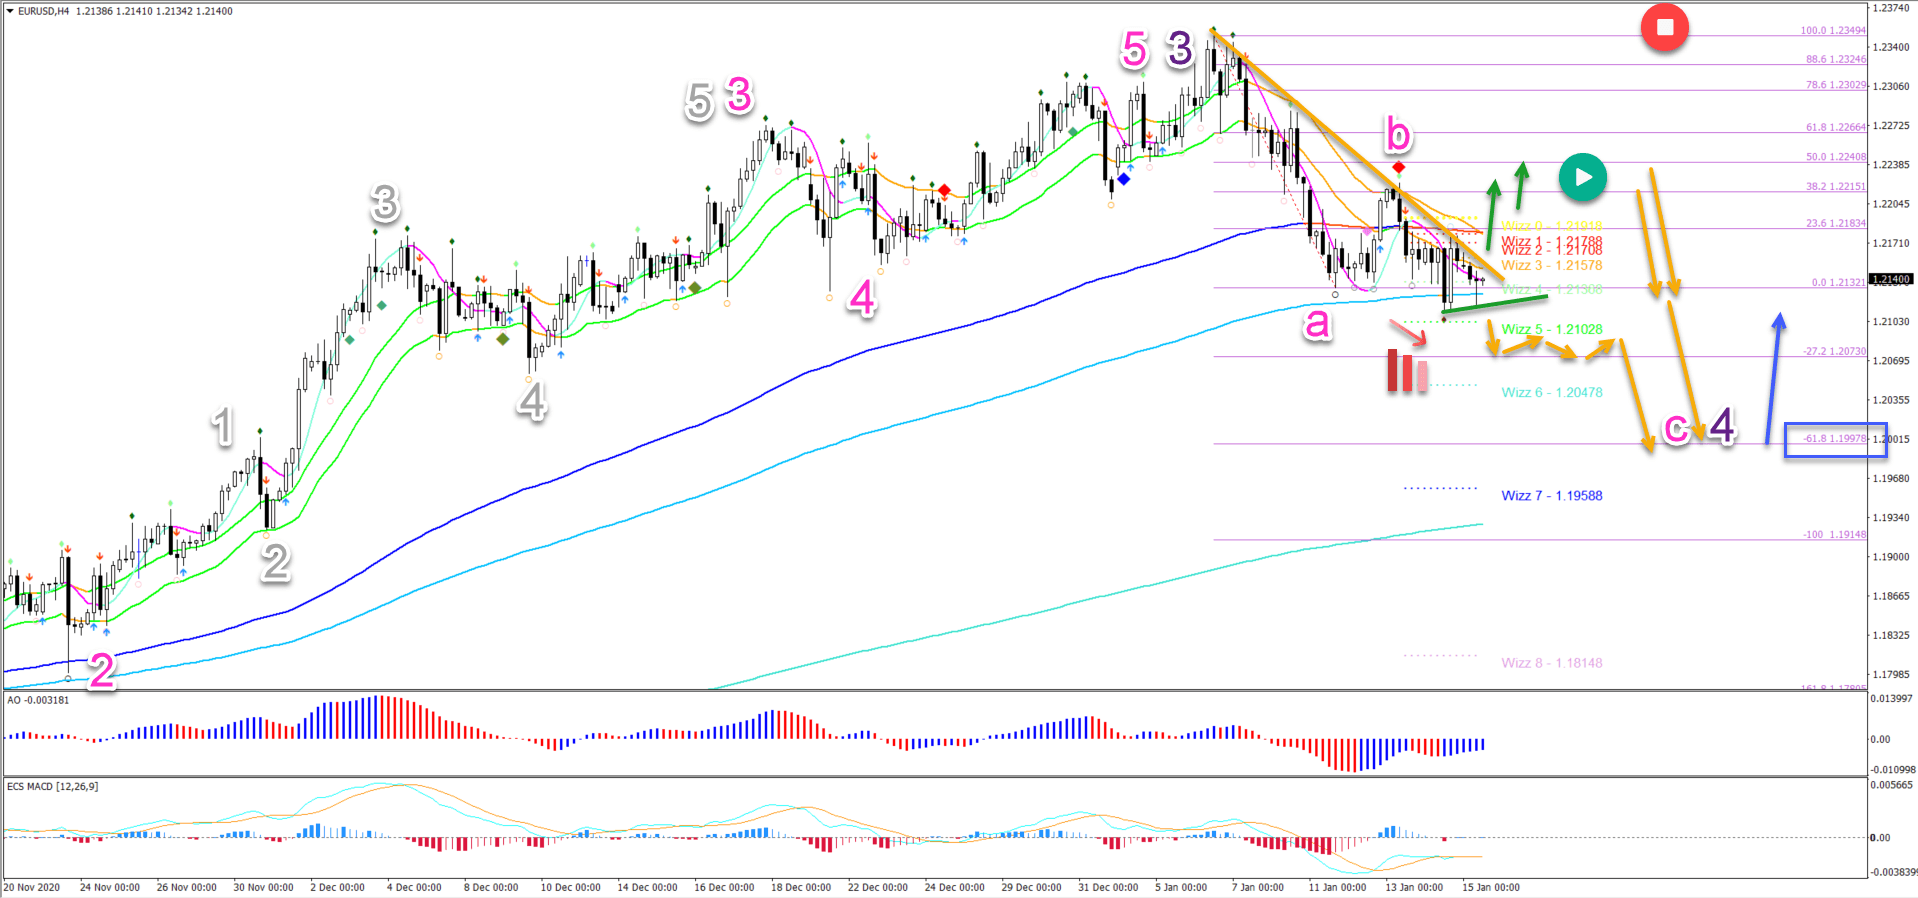
EUR/USD is breaching the 144 ema support zone. This indicates bearish pressure. A breakout could confirm the decline in wave C (pink).
-
The EUR/USD needs to push below the support trend line (green). This confirms the bearish break and ABC (pink) zigzag pattern (orange arrows).
-
The main target is located at the confluence of the -61.8% Fibonacci target and psychological round level at 1.20 (blue box).

Price Charts and Technical Analysis
A break above the resistance trend line (orange), however, indicates a bullish retracement first (green arrows). The main resistance zone is at the Fibonacci levels of wave B (pink).
The ABC pattern could complete a larger wave 4 (purple) of the uptrend.
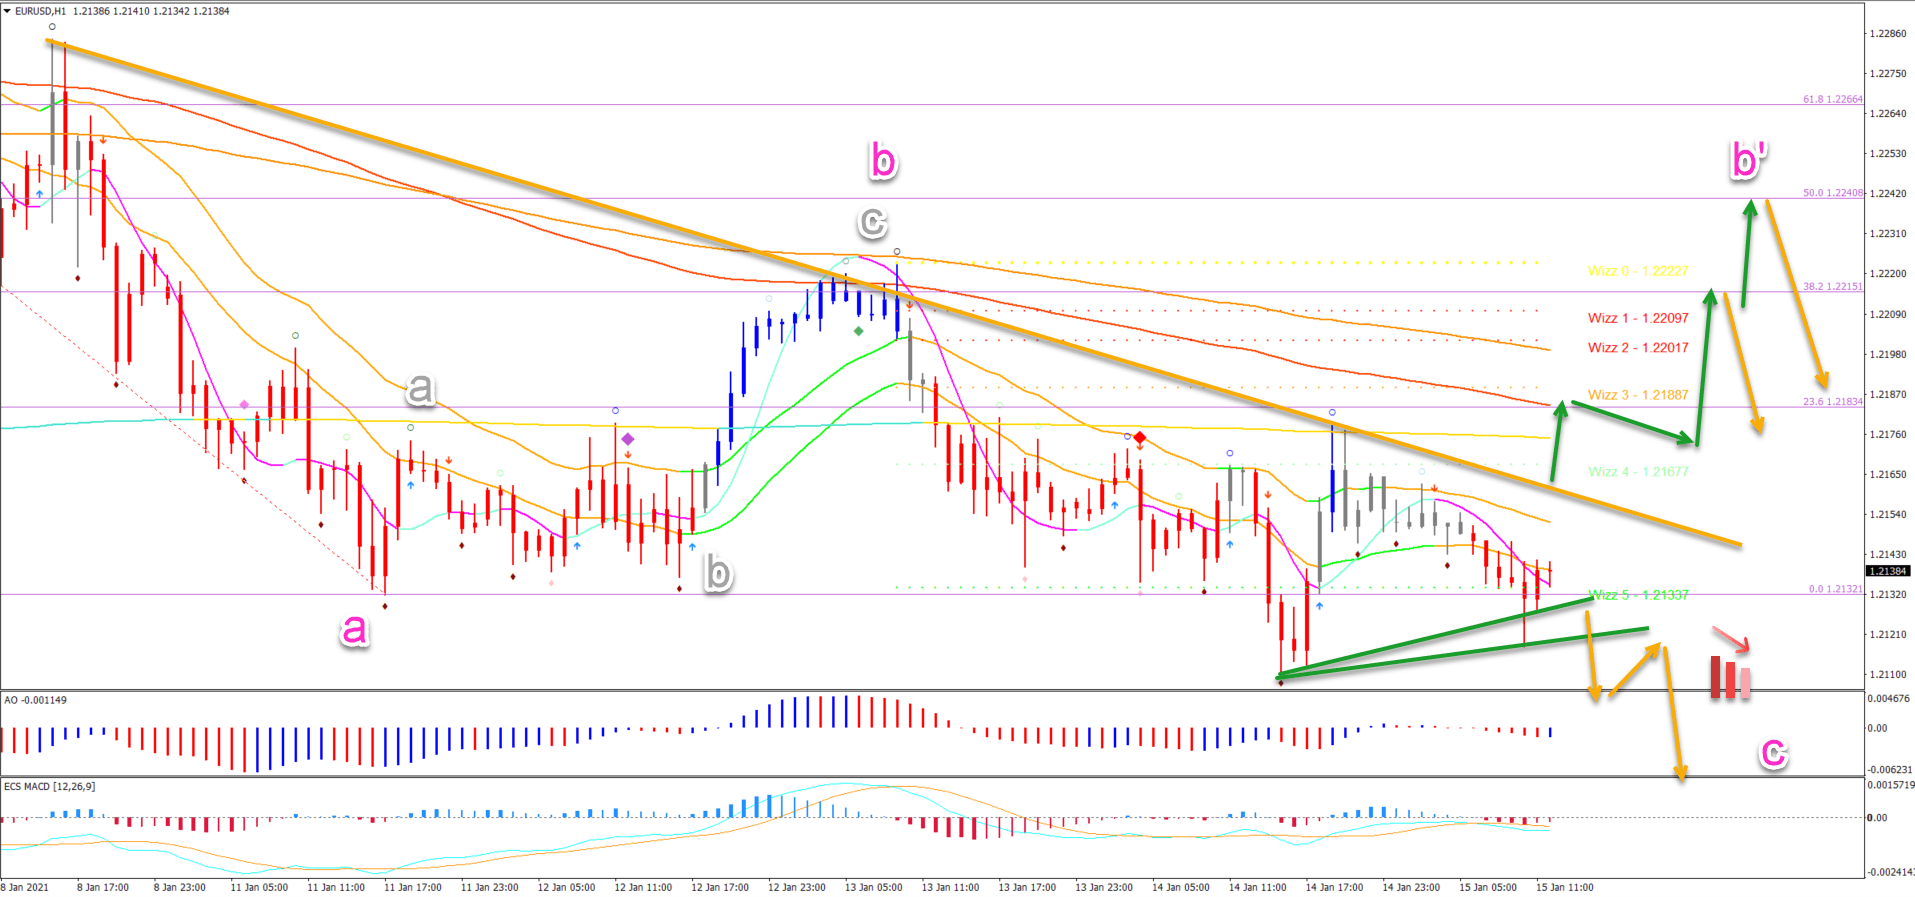
On the 1 hour chart, a completed ABC (grey) pattern is visible within wave B (pink). The bearish price action is clear with lower lows and lower highs. The trend line (orange) is another confirmation.
But price action will need to push below support to start the breakout. Otherwise a counter trend retracement does linger as a danger.
The analysis has been done with the ecs.SWAT method and ebook.
Author

Chris Svorcik
Elite CurrenSea
Experience Chris Svorcik has co-founded Elite CurrenSea in 2014 together with Nenad Kerkez, aka Tarantula FX. Chris is a technical analyst, wave analyst, trader, writer, educator, webinar speaker, and seminar speaker of the financial markets.


