EUR/USD: Bearish Market Patterns

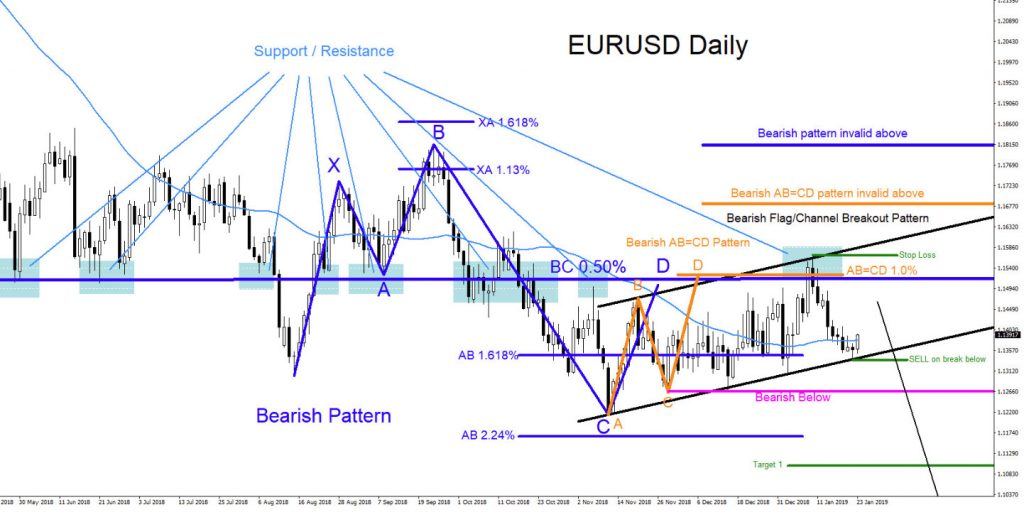
EURUSD Technical Analysis August 18/2019 In January of 2019 I published the EURUSD SELL breakout trade setup (EURUSD: Will Pair Break Lower) explaining that bearish market patterns were clearly visible and was calling for a move lower towards 1st Target at 1.1060.
EURUSD Daily Chart 1.23.2019
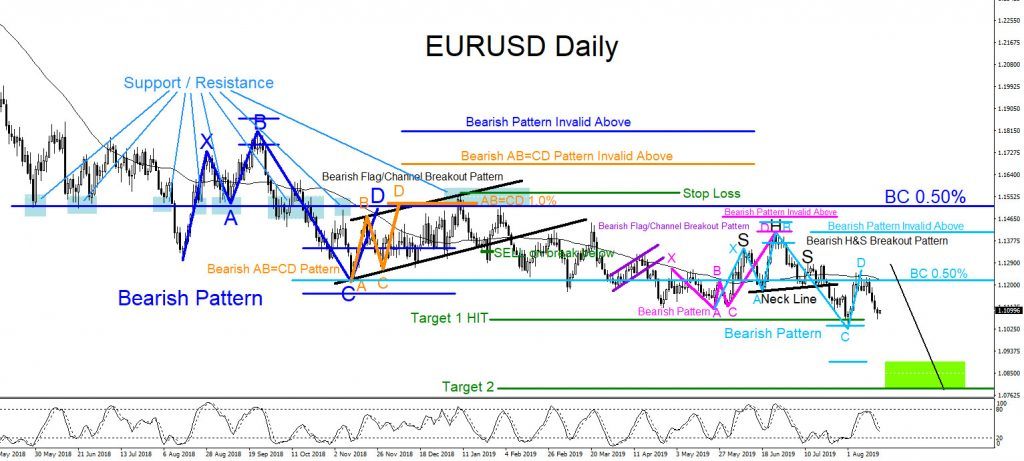
Fast forward to August 2019. In the chart below bearish market patterns continued to form causing the pair to continue moving lower and finally hitting the 1.1060 1st target level. All bearish market patterns shown below triggered sells at their precise entry points and all pushed EURUSD lower. Not one market pattern was invalidated showing that bears had control. At the moment only one bearish market pattern remains which is the light blue bearish pattern. Light blue bearish pattern has already triggered sells at the BC 0.50% area and has moved lower from this level. The light blue bearish pattern still needs to break below the point C of the pattern so expect for price to continue lower towards the green box target zone near the 2nd target. As long as price stays below the June 2019 high invalidation level we expect EURUSD to continue lower to the 1.0890 minimum level which is the top of the green box target zone. Any moves higher towards the light blue BC 0.50% level traders should look for possible selling opportunities.
EURUSD Daily Chart 8.18.2019
Get more financial insights like these -- 100% free. Just follow this link
Author

Elliott Wave Forecast Team
ElliottWave-Forecast.com


