EUR/USD battling key support, break or bounce? – Confluence Detector

The EUR/USD is still looking for a direction ahead of the ECB meeting and US GDP. Where will it go to?
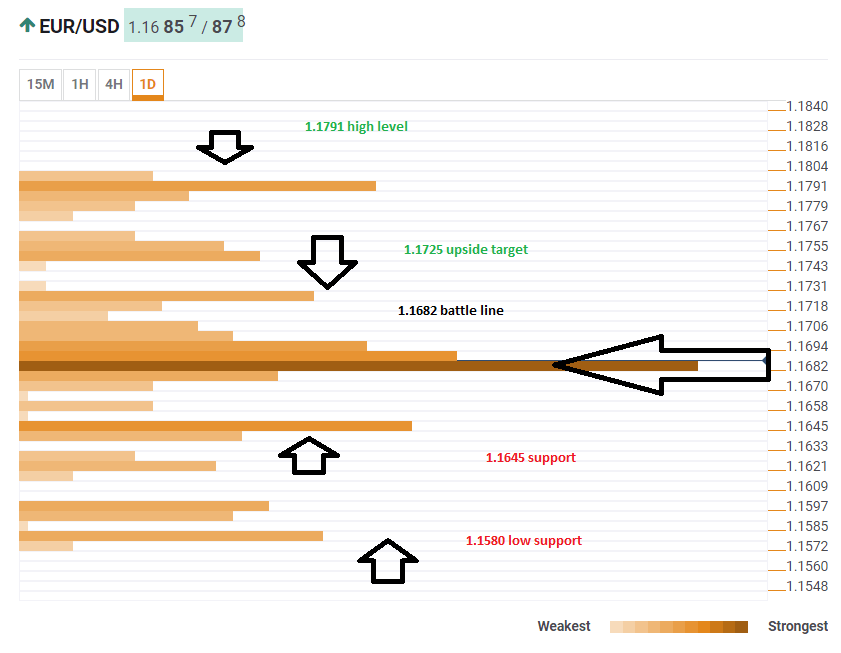
The Technical Confluences Indicator shows that 1.1682 is a dense congestion of the technical levels. This includes the Bolinger and 15m-Lower, the Simple Moving Average 50-4h, the SMA one-day, the Fibonacci 38.2% one-day, the Fibonacci 38.2% one-week, the SMA 10-15m, the BB 15m-Middle, and the SMA 5-15m, 50-15m, 10-1h, 50-one-day, 100-15m, and 100-4h.
Should the pair rise up, 1.1725 could slow or halt its ascent as it is the convergence of the Fibonacci 61.8% one-month and the Pivot Point one-day Resistance 1. Further above, 1.791 is the meeting point of the Pivot Point one-week Resistance 1 and last month's high.
On the downside, 1.1645 us notable, We find the Fibonacci 38.2% one-month, the Fibonacci 61.8% one-week, and the Bolinger Band 4h-Lower. Even lower, 1.1580 is the confluence of the Bolinger Band one-day Lower and last week's low.
Here is how it looks on the tool:
Confluence Detector
The Confluence Detector finds exciting opportunities using Technical Confluences. The TC is a tool to locate and point out those price levels where there is a congestion of indicators, moving averages, Fibonacci levels, Pivot Points, etc. Knowing where these congestion points are located is very useful for the trader, and can be used as a basis for different strategies.
This tool assigns a certain amount of “weight” to each indicator, and this “weight” can influence adjacents price levels. These weightings mean that one price level without any indicator or moving average but under the influence of two “strongly weighted” levels accumulate more resistance than their neighbors. In these cases, the tool signals resistance in apparently empty areas.
Author

Yohay Elam
FXStreet
Yohay is in Forex since 2008 when he founded Forex Crunch, a blog crafted in his free time that turned into a fully-fledged currency website later sold to Finixio.


