|

EUR/USD approaching dense resistance cluster at $1.2325 — Confluence Detector

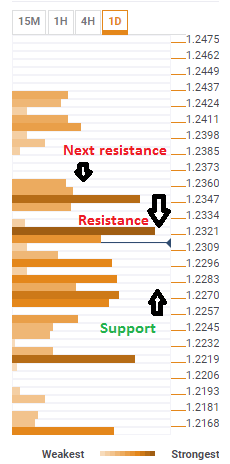
The Technical Confluences Indicator, shows that the EUR/USD is approaching a resistance area where many critical technical levels converge. The $1.2325 level is where the SMA100-4h, the SMA200-4h, the Bolinger Band 1 day Middle (Stdv 2.2), BB 1h-upper, Pivot Point one-day Resistance 1, the SMA5-15m, and the BB 15m Upper all meet. 

A break higher will open the door to the $1.2348 region where the there is another significant cluster featuring the one-week high, the Pivot Point one week R1, the PP one day R2, and the SMA50 one day meet. 

A failure will open the door to the previous and choppy trading area around $1.2275 which has the SMA100-15m, the Fibo 61.8% one-month, BB one hour Middle, the SMA50, the SMA10-1h and more lines. 

All in all, the lines to the upside are more apparent than those to the downside.

Here is how it looks on the tool:

Confluence Detector

The Confluence Detector finds exciting opportunities using Technical Confluences. The TC is a tool to locate and point out those price levels where there is a congestion of indicators, moving averages, Fibonacci levels, Pivot Points, etc. Knowing where these congestion points are located is very useful for the trader, and can be used as a basis for different strategies.

This tool assigns a certain amount of “weight” to each indicator, and this “weight” can influence adjacents price levels. This means that one price level without any indicator or moving average but under the influence of two “strongly weighted” levels accumulate more resistance than their neighbors. In these cases, the tool signals resistance in apparently empty areas.

Learn more about Technical Confluence

Author

Yohay Elam

Yohay Elam

FXStreet

Yohay is in Forex since 2008 when he founded Forex Crunch, a blog crafted in his free time that turned into a fully-fledged currency website later sold to Finixio.

More from Yohay Elam
Share:

Editor's Picks

EUR/USD consolidates around 1.0900, bullish bias remains ahead of key US data

The EUR/USD pair is seen consolidating its strong gains registered over the past two days and oscillating in a narrow band during the Asian session on Tuesday. Spot prices currently trade around the 1.1900 mark, just below an over one-week high touched the previous day.

GBP/USD tilts bullish as markets barrel toward mid-week NFP print

GBP/USD is holding a broader bullish structure on the daily chart, with price trading well above the 50 Exponential Moving Average at 1.3507 and the 200 EMA at 1.3310, confirming the intermediate uptrend that has been in place since the November 2025 low near 1.2300. 

Gold: Will US Retail Sales data propel it above $5,100?

Gold hovers below weekly highs of $5,087 early Tuesday, await US Retail Sales data. The US Dollar enters a downside consolidation phase amid persistent Japanese Yen strength and worsening labor market. Gold settled Monday above $5,000, now looks to take out $5,100 amid bullish daily RSI.

Top Crypto Gainers: World Liberty Financial, MemeCore and Quant gain momentum

World Liberty Financial, MemeCore, and Quant are leading gains over the last 24 hours as the broader cryptocurrency market stabilizes after last week’s correction. Still, the technical outlook for altcoins remains mixed due to prevailing downside pressure and vulnerable market sentiment. 

Follow the money, what USD/JPY in Tokyo is really telling you

Over the past two Tokyo sessions, this has not been a rate story. Not even close. Interest rate differentials have been spectators, not drivers. What has moved USD/JPY in local hours has been flow and flow alone.

Ripple exposed to volatility amid low retail interest, modest fund inflows

Ripple (XRP) is extending its intraday decline to around $1.40 at the time of writing on Monday amid growing pressure from the retail market and risk-off sentiment that continues to keep investors on the sidelines.