GBP/USD has one more tough resistance before running higher — Confluence Detector

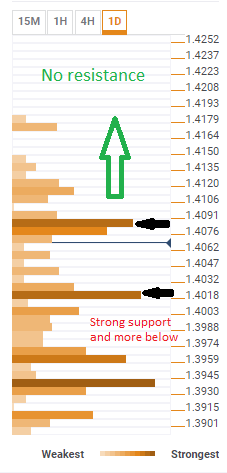
The Technical Confluences Indicator shows that the GBP/USD faces tough resistance around $1.4080. The area is a confluence of several key technical indicators: the Fibo 61.8% 1M, Pivot Point 1w R2, one month high, Bolinger Band 15m-Upper Stdv 2.2 and a 4h high.
However, above this line, there are very few lines of resistance that are not clustered and are of lesser importance.
On the downside, we note a cluster around $1.4020: the SMA 5 4h, SMA-100 15m, Bolinger Band 1h Middle Stdv 2.2 and the SMA10-4h among others. This is followed by further lines of support that are guarding the $1.4000 level.
All in all, a move to the downside will find strong support followed by further cushions while a move to the upside if it succeeds to convincingly break above $1.4080, has room to run to $1.4250 and beyond.
Here is how it looks:
Confluence Detector
The Confluence Detector finds interesting opportunities using Technical Confluences. The TC is a tool to locate and point out those price levels where there is a congestion of indicators, moving averages, Fibonacci levels, Pivot Points, etc. Knowing where these congestion points are located is very useful for the trader, and can be used as a basis for different strategies.
This tool assigns a certain amount of “weight” to each indicator, and this “weight” can influence adjacents price levels. This means that one price level without any indicator or moving average but under the influence of two “strongly weighted” levels accumulate more resistance than their neighbors. In these cases, the tool signals resistance in apparently empty areas.
Author

Yohay Elam
FXStreet
Yohay is in Forex since 2008 when he founded Forex Crunch, a blog crafted in his free time that turned into a fully-fledged currency website later sold to Finixio.


