EUR/USD and USD/CAD technical outlook: Potential reversals and key levels

After a relatively calm summer, the foreign exchange market has been jolted by a significant surge in the US dollar index (DXY)—its best day since early May. This move was largely driven by a dramatic sell-off in the euro, though the dollar also outperformed across most major currency pairs.
The FX market is now closely watching technical setups in EURUSD and USDCAD, both of which are approaching critical inflection points.
EUR/USD: Price action overview
The EURUSD pair has been on a sharp decline, now testing a long-standing descending channel on the 4-hour chart. This zone—around the 1.155 area—has previously acted as reliable support.
Technical analysis: EUR/USD in descending channel
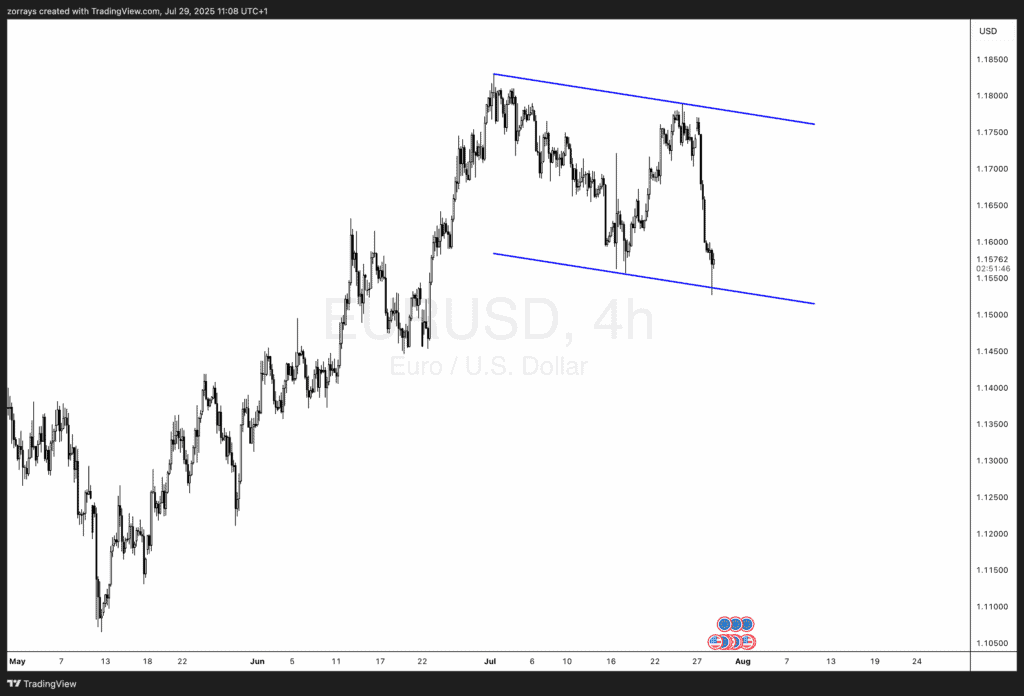
The descending channel structure on the EURUSD chart has been in play since early July. While the recent drop looks aggressive, it neatly touches the lower bound of this bearish channel. This technical confluence hints at a possible turnaround.
What’s supporting this view:
-
The price action has consistently respected this channel.
-
Sharp sell-offs like this often stall near support zones.
-
The RSI is nearing oversold territory on lower timeframes.
Should EURUSD find buyers here, a move back toward 1.1700–1.1750 is feasible.
Fundamentals driving EUR/USD
The euro’s recent weakness may not just be technical. There’s a broader story of stale conviction in long euro trades, particularly those driven by hopes of a strong EU trade environment and tight correlation with the German DAX index.
Moreover, poor follow-through buying in early Europe suggests speculative longs were caught offside, triggering a broader exit.
Macro events impacting the Euro
-
FOMC Meeting (July 30): If the Fed maintains its hawkish bias, further dollar strength could be seen—but the market may have already priced this in.
-
EU Sentiment: The delay or disappointment in trade deal news has added to bearish pressures.
USD/CAD: Price action overview
USDCAD has rallied sharply from mid-July lows but is now approaching a critical resistance zone around 1.377—clearly marked as an invalidation level on many charts.
Technical analysis: USD/CAD compression triangle
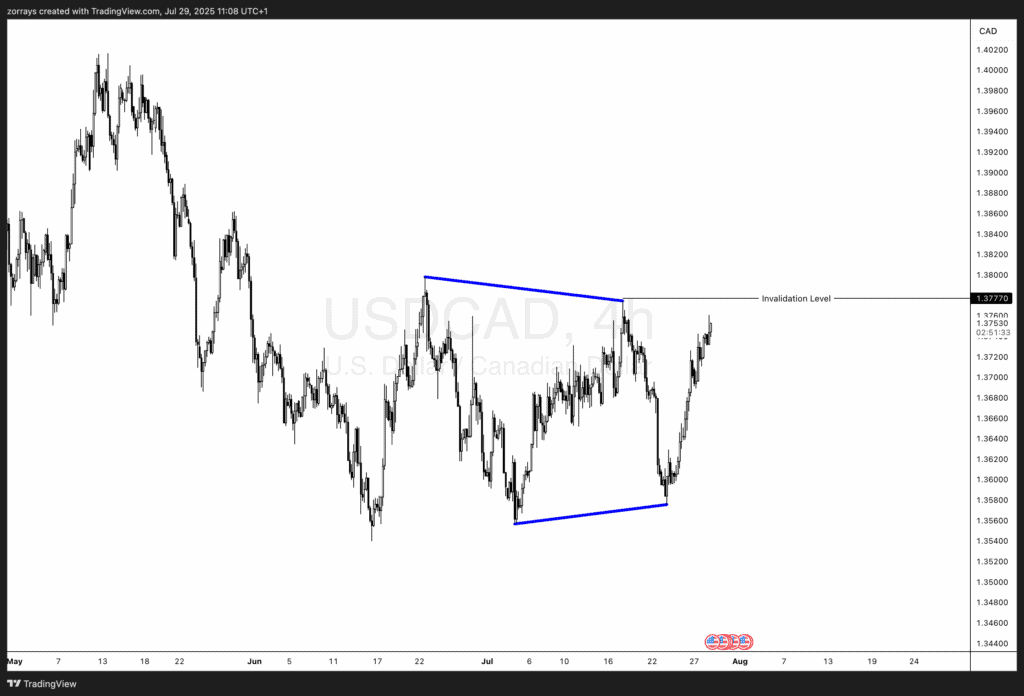
A large symmetrical triangle has formed on the 4-hour timeframe. Price is currently nearing the upper bound, just under the 1.377 level.
What this suggests:
-
A failure to break above 1.377 could trigger a sell-off back toward 1.355 or lower.
-
The compression within the triangle shows price tension—likely to resolve with a breakout soon.
-
Bias remains bearish unless the upper trendline is breached.
Fundamentals driving USD/CAD
The Canadian dollar has been supported by oil prices and relatively firm domestic data. However, geopolitical risks surrounding Russian crude (amid shortened ceasefire deadlines) have started influencing energy markets again, indirectly impacting CAD.
On the US side, strong economic numbers like JOLTS and Consumer Confidence could keep USD buoyant—unless they disappoint.
Why 1.377 is the Invalidation Level
-
This level has acted as resistance multiple times since mid-June.
-
A breakout above this zone would invalidate the triangle breakdown thesis.
-
Traders are advised to treat 1.377 as a hard stop for bearish setups.
DXY: The common thread between EUR/USD and USD/CAD
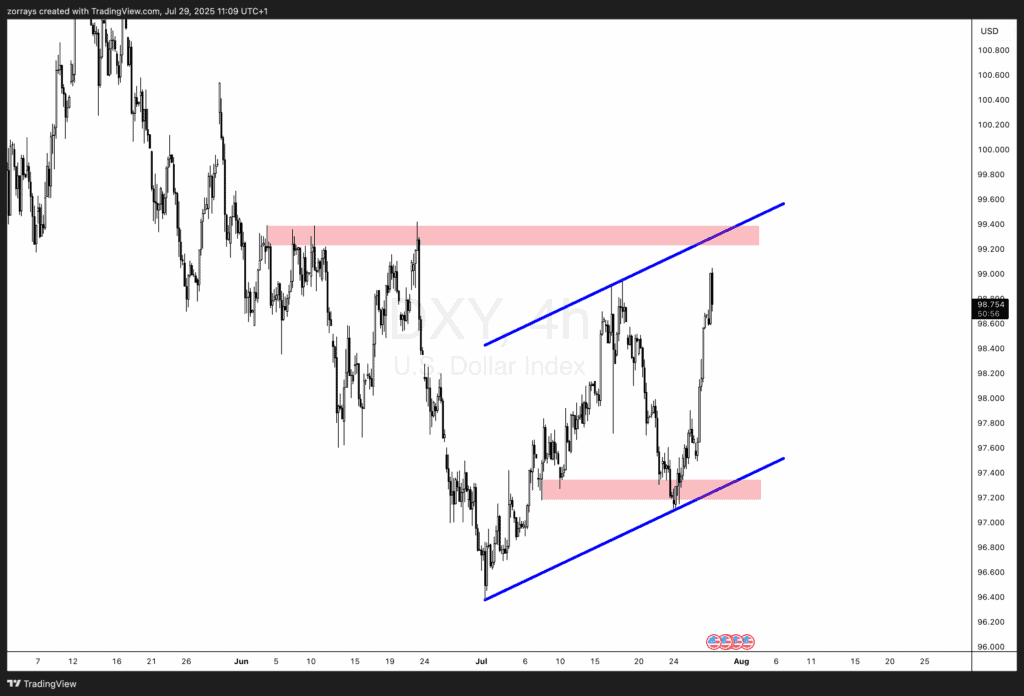
The DXY, which is heavily weighted by EURUSD, is playing a pivotal role in both setups:
-
Above 98.80/95: Triggers more USD strength.
-
Toward 99.50 or 100.50: Could weigh on EURUSD and cap USDCAD upside.
Near-term trading strategies
EUR/USD:
-
Longs can be initiated near the lower channel bound with a stop just below 1.150.
-
Target area: 1.1700–1.1750.
USD/CAD:
-
Shorts are attractive near 1.377 with invalidation slightly above.
-
Downside target: 1.355 initially, extended to 1.345.
Risk management tips for volatile moves
-
Avoid entering trades around major news events like FOMC.
-
Place stop-loss orders slightly outside key invalidation zones.
-
Use smaller position sizes if trading both EURUSD and USDCAD concurrently to hedge directional risk.
Event risks traders must watch this week
-
JOLTS Job Openings (Today): Expected stability around 7.5 million.
-
Consumer Confidence: Could mirror strong stock market performance.
-
FOMC Meeting: Major risk event—hawkish surprise would lift USD.
-
Quarterly Funding Announcement: Watch for long-duration issuance surprises.
Positioning and sentiment analysis
Speculative long positions in EURUSD are increasingly fragile. Sentiment has shifted, and many institutions are reevaluating euro exposure.
In contrast, CAD positioning is more neutral, but sensitive to oil price volatility—particularly if Russian crude faces secondary sanctions.
Conclusion: Strategic outlook into August 2025
Both EURUSD and USDCAD are trading at crucial inflection points:
-
EURUSD looks set for a possible rebound from its descending channel.
-
USDCAD shows signs of bearish pressure, provided 1.377 holds.
-
The dollar’s strength could extend short term, but technicals hint at mean reversion opportunities, particularly in EURUSD.
Frequently asked questions
1. What’s the key support level for EURUSD now?
The lower bound of the descending channel around 1.1550 is a key support zone.
2. Can USDCAD break out above 1.377?
Yes, but that would invalidate the bearish triangle thesis. Below that, the bias remains downward.
3. How does DXY influence both pairs?
Since EURUSD is a major component of DXY, any movement in the index often reflects euro strength/weakness. USDCAD is also affected due to overall dollar flows.
4. Is it a good time to long the euro?
Technically, yes—if price holds the lower channel support. But monitor upcoming events like the FOMC.
5. What could cause USDCAD to drop sharply?
A rejection at 1.377 combined with falling oil supply fears or dovish Fed remarks could trigger a drop.
6. Should I trade before the FOMC?
It’s best to trade lightly or wait until after the announcement due to expected volatility.
Author

Zorrays Junaid
Alchemy Markets
Zorrays Junaid has extensive combined experience in the financial markets as a portfolio manager and trading coach. More recently, he is an Analyst with Alchemy Markets, and has contributed to DailyFX and Elliott Wave Forecast in the past.


