EUR/USD analysis: when do you think ECB's officers will start jawboning?

EUR/USD Current price: 1.1900
- Daily pullback hardly affecting the trend.
- ECB's officers not showing signs of concerns about EUR's strength… yet.
Action around the EUR/USD pair was limited at the beginning of the week, with the pair confined to a tight trading range. Nevertheless, the pair set a fresh multi-week high of 1.1960 before retreating to the current 1.1900 region, as dollar's weakness was the main theme of the day. There were no macroeconomic releases coming from the EU and that from the US was mixed, with New Home Sales rose in October 6.2%, to 0.685M, well above the 0.625M expected. The Dallas Fed manufacturing index for November, however, came below expected at 19.4 in November from previous 27.6 and market's forecast of 24.0, indicating anyway solid economic expansion.
This Tuesday the macroeconomic calendar will have plenty of minor figures to offer and a couple of FOMC officers will hit the wires, which will add to later inflation figures, ahead of Fed's December decision. The EUR/USD pair recent rally has been mostly amid dollar's weakness, with the pair now stabilizing above pre-ECB's levels. The European Central Bank has been working hard to keep the common currency in check, as a continued appreciation will play against inflation and growth progress, so necessary now that the Central Bank is trimming its bond-buying program, on hopes to reach normalization in the near future. This recovery surely is not welcome by ECB's authorities, but after acting last month, they have now little room to maneuver, beyond some jawboning. A dollar's recovery, on market's conviction that the Fed will maintain the tightening path through 2018 is what they need, and that still looks blurry.
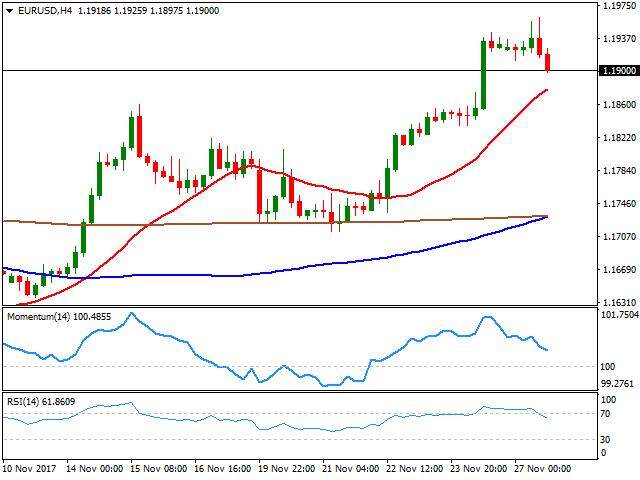
Technically and for the upcoming sessions, the pair retains the bullish stance despite the modest daily pullback, as in the 4 hours chart, technical indicators have managed to correct extreme overbought conditions, but remain well into positive territory, with the RSI around 62 indicating a limited downward strength. In the same chart, the 20 SMA maintains its bullish slope around 1.1870, reinforcing the view. The 1.1890 region is the immediate support, en route to 1.1860, while only below 1.1820 bulls will lose hope, handing the grip to bears.
Support levels: 1.1890 1.1860 1.1825
Resistance levels: 1.1960 1.2000 1.2045
Author

Valeria Bednarik
FXStreet
Valeria Bednarik was born and lives in Buenos Aires, Argentina. Her passion for math and numbers pushed her into studying economics in her younger years.


