EUR/USD analysis: recovery not enough to erase the sour tone

EUR/USD Current price: 1.2328
- EU inflation, and German GDP to be out Friday, none enough to affect sentiment trading.
- US downward correction directly linked to equities an yields' behavior.
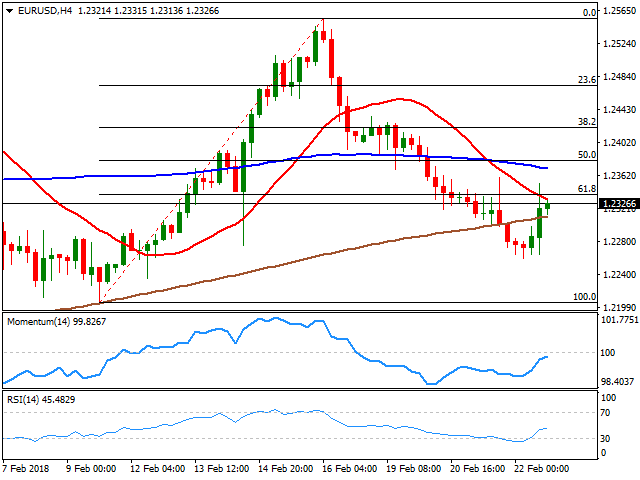
Following four days of steady gains, the greenback turned lower this Thursday, losing ground against most of its major rivals. The EUR/USD pair regained the 1.2300 level, but not before reaching a fresh over 1-week low of 1.2259 during Asian trading hours, with a strong recovery in equities and easing yields hitting the greenback. Macroeconomic data was again ignored, as figures coming from the EU were disappointing, while US ones, encouraging. The German IFO business climate indicator for February fell to 115.4 from 117.6 in January, while the assessment of the current situation shrunk to 105.4 from a previous 108.3, both missing market's expectations. Also, the ECB released the Accounts of its latest monetary policy meeting, showing that policymakers think is premature to change its forward guidance, as inflation remains well below the central bank's target of just below 2%, adding, however, that they could revisit its forward guidance on quantitative easing early this year. In the US, on the other hand, weekly unemployment claims fell to 222K for the week ended February 16th, better, than the 230K expected, while the Kansas Fed manufacturing activity index for February printed 21, largely surpassing the previous 16 or the expected 18.
Friday will bring German Q4 GDP, EU January inflation and a couple of Fed members´ speeches later in the day, none of them capable to offset sentiment-related trading, which means that equities and yields will probably keep leading the way.
The EUR/USD pair peaked at 1.2351 after bottoming for the day at 1.2259 during Asian trading hours, now around 1.2325, and below a critical resistance, the 61.8% retracement of the February rally around 1.2340. Next in line, should the pair clears this up, would be the 1.2380 region, where the pair has the 50% retracement of the same rally. Technical indicators in the 4 hours chart have extended their recoveries from oversold levels up to their mid-lines, without surpassing them, somehow indicating that buying interest is still limited. Furthermore, the pair remains below a bearish 20 SMA, a few pips below the mentioned 1.2340 Fibonacci level, while the 100 SMA is closer to the next Fibonacci resistance. Below the daily low, on the other hand, the pair will turn bearish with scope then to test the 1.2205 level, February low.
Support levels: 1.2300 1.2260 1.2225
Resistance levels: 1.2340 1.2380 1.2425
Author

Valeria Bednarik
FXStreet
Valeria Bednarik was born and lives in Buenos Aires, Argentina. Her passion for math and numbers pushed her into studying economics in her younger years.
















