EUR/USD: A break lower 1.0650 is a sell signal [Video]
![EUR/USD: A break lower 1.0650 is a sell signal [Video]](https://editorial.fxstreet.com/images/Markets/Currencies/Majors/EURUSD/Euro_USDollar_EURUSD_pocket_XtraLarge.jpg)
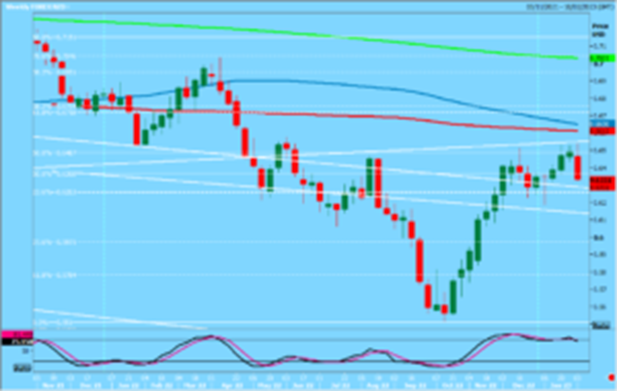
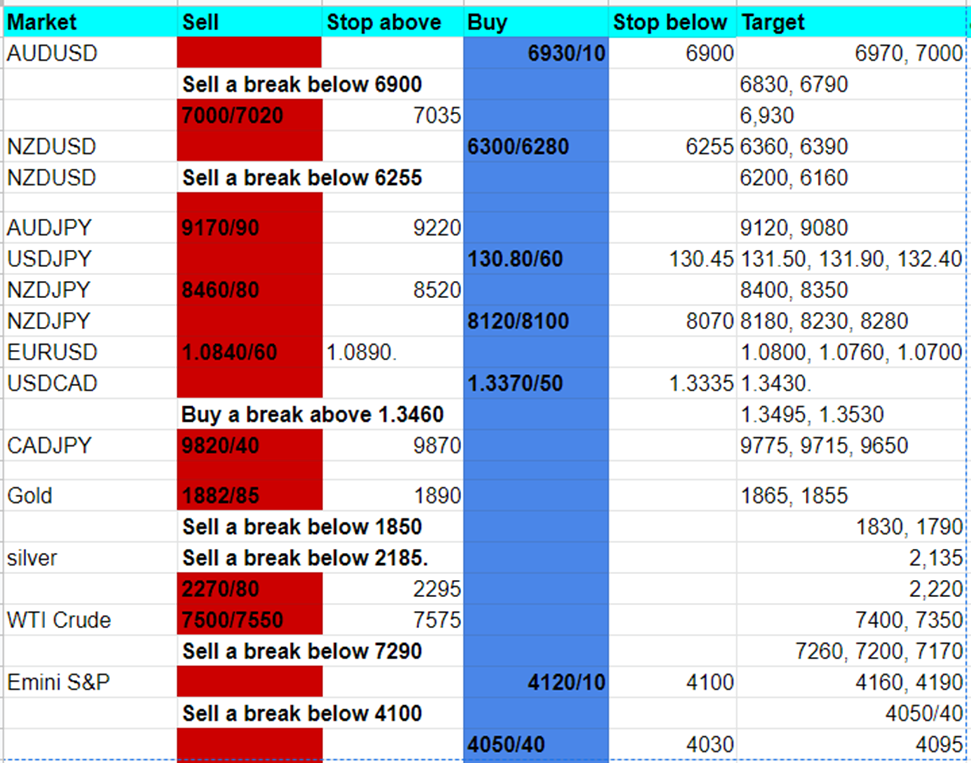
AUDUSD rejected the 100 week & the 500 day moving averages at 7160/80 & collapsed through support at 7060/50 on Friday for a sell signal targeting 6990/80 & 6930/20. A low for the day exactly here in fact. This is key 23.6% Fibonacci & 3 month trend line support at 6930/10. Longs need stops below 6300. An open on Sunday night below 6300 or a break lower on Monday is a sell signal targeting 6830/20, perhaps as far as 6790/80.
A huge bearish engulfing candle on the weekly chart suggests the longer term bull trend for US dollar has resumed.
Holding support at 6930/10 targets 6970/80. It's possible we continue higher to strong resistance at 7000/7020. Shorts need stops above 7035.
NZDUSD shorts at 6430/60 certainly worked perfectly if you held them over the NFP number (although I would never advise that of course). Again a huge bearish engulfing candle on the weekly chart suggests the longer term bull trend for US dollar has resumed.
Key support at 6300/6280 - we can still have a bounce after a bearish engulfing candle. If you try longs, stop below 6255 - targets are 6360/70, perhaps as far as resistance at 6400/20. Shorts need stops above 6435.
A break below 6255 is a sell signal targeting 6200/6190, perhaps as far as 6160/50.
AUDJPY resistance at 9180/9200. Shorts need stops above 9220.
A break below 9065 re-targets 9040 & 9010/00, perhaps as far as 8970.
USDJPY shot higher through strong resistance at 130.65/85 for a buy signal. The bullish engulfing candle on the weekly chart suggests the longer term bull trend for the US dollar has resumed. Holding above strong support at 130.80/60 targets 131.50/60, 131.90 & 132.40/50.
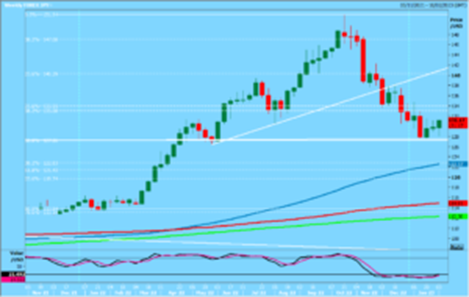
Longs at 130.80/60 stop below 130.45.
EURJPY very choppy - up one day, down the next day in the 6 week sideways trend - I cannot find low risk trade opportunities so I have to wait for a breakout.
NZDJPY strong support at the lower end of the range at 8120/8100. Longs need stops below 8070. A break lower is a sell signal initially targeting 7960/40, perhaps as far as 7880/60.
It is difficult to find tradeable levels in the wide sideways trend. We have strong resistance again at 8460/80. Stop above 8520. Above here is a buy signal & can target 8590 then 8630.
EURUSD made a high for the week exactly at rising trend line resistance at 1.1010/20. A huge bearish engulfing candle on the weekly chart suggests the longer term bull trend for the US dollar has resumed. Holding below 1.0820/30 today can target 1.0760/50, perhaps as far as today's support at 1.0690/70. Longs need stops below 1.0650. A break lower is a sell signal initially targeting 1.0600 & eventually strong support at 1.0470/50. Longs need stops below 1.0430.
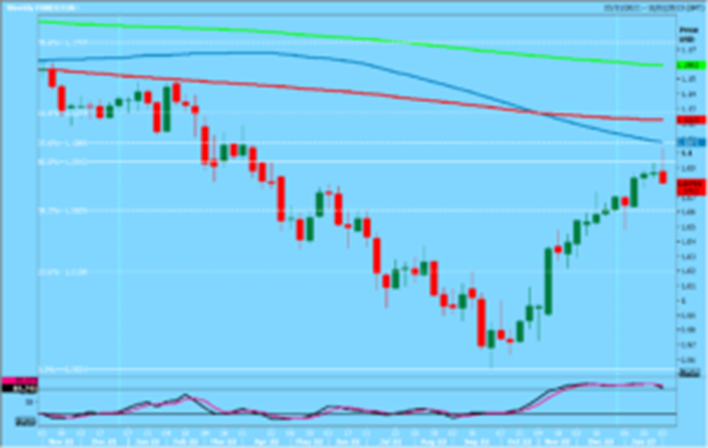
Gains are likely to be limited after the important sell signal on the weekly chart - strong resistance at 1.0840/60 on any bounce today - shorts need stops above 1.0890.
USDCAD shot higher to leave a bullish engulfing candle on the weekly chart. We meet first resistance at 1.3430/50, although shorts may be too risky. A break above 1.3460 is a buy signal targeting 1.3495/1.3305 then 1.3530/40.
Support at 1.3370/50. Longs need stops below 1.3335.
EURCAD establishing a wild sideways consolidation, possibly a bull flag, so I must wait for the pattern to become clearer. Resistance at the January high at 1.4630/40. A break higher this week is a buy signal.
Support at the of end of the 2 week range at 1.4455/35 so a break below 1.4425 is a sell signal targeting 1.4390/80, perhaps as far as 1.4320/10.
EURNZD holding above 1.7035/25 is a buy signal targeting 1.7140/50. Longs need stops below 1.7000.
GBPUSD broke the lower end of the recent range at 1.2280/60 for a sell signal targeting 1.2145/25 & the break below 1.2115 was the next sell signal on Friday - we hit 1.2047. Outlook remains negative as we look for a test of support at 1.1960/40. A low for the day is possible but longs need stops below 1.1920.
Author

Jason Sen
DayTradeIdeas.co.uk


