EUR: Misleading indicators, portfolio flows and hot money
One gauge of EUR/$ sentiment in the FX options world gives the impression that EUR/$ should turn higher. Yet we think that's a misleading indicator. Instead, interest rate differentials and hot money are swamping what otherwise would be a good Balance of Payments story for the euro. Unless the Fed cuts much more aggressively, expect EUR/$ to stay offered
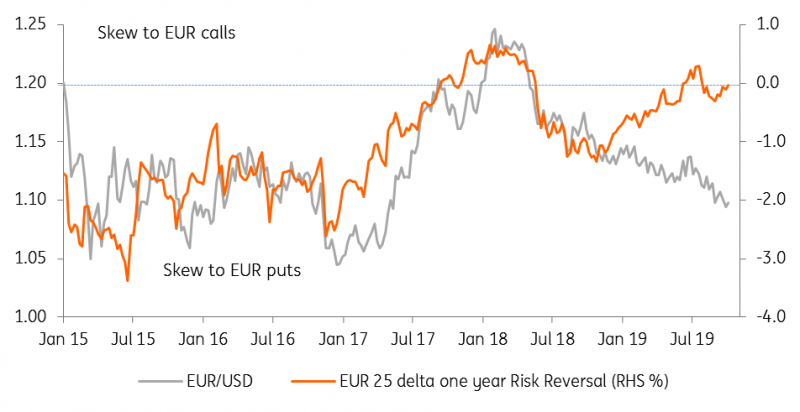
Chart 1: EUR/USD is now diverging from the Risk Reversal
Misleading indicator
In the FX market, one measure of sentiment comes from the derivatives world and is called the ‘Risk Reversal'. This represents the difference in price the market (corporates and institutional investors) is prepared to pay for a similar EUR call or EUR put option. When the market has a negative view on EUR/USD, conventional wisdom goes that the market will be more interested in buying EUR puts to protect against a weaker EUR than EUR call options to protect against a stronger EUR. The ‘skew', or difference in those prices, can be as much as 3%, as you can see in the chart above.
Typically the EUR/USD Risk Reversal trades very much in line with the EUR/USD spot rate and divergence is rare. Yet this year has seen EUR/USD sink below 1.10, whilst the Risk Reversal has resolutely moved higher. Does this mean the market doesn't believe the EUR/USD bear story and EUR/USD could be overdue a turn higher? Not necessarily.
Speaking to our experts in the FX options team, a couple of views come through – with which we agree. The first is that the Risk Reversal should, in theory, represent the market pricing a higher probability of the environment becoming more volatile as spot moves in the direction of the skew. For example, if the market prices EUR puts more expensively than EUR calls, volatility should rise as EUR/USD sinks. That has certainly not been the story this year.
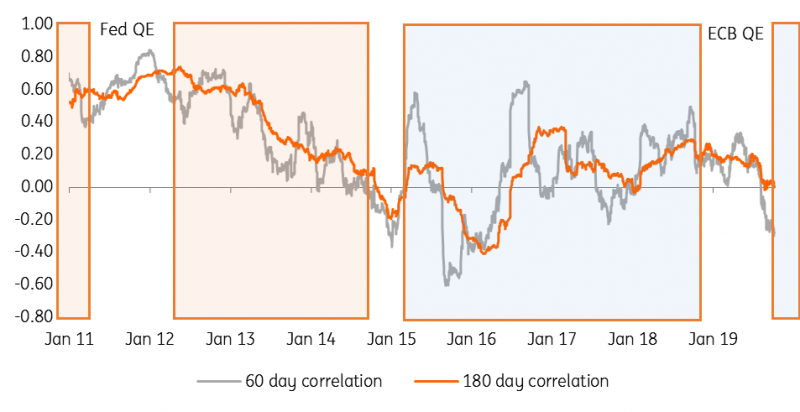
Driving that change we think has been negative rates in Europe and now a fresh round of Quantitative Easing due to start from the ECB in November. As we outline in the chart below, bouts of money printing (both from the Fed and the ECB) typically in the early stages see the local currencies take on negative correlations with risk (in our case the performance on the MSCI World equity index). The EUR is now exhibiting the characteristics of a funding currency, represented by the phrase ‘Risk on, EUR off'. That's why the relationship between a weaker EUR and higher volatility has broken down and the current divergence is not a harbinger of an imminent upside rally in EUR/USD.
The second argument is that the one-year area of the FX options market is dominated by corporates. Since actual volatility is so low (one year EUR/USD realised volatility has now dropped back to the cycle low of summer 2014 because of the low rate environment), corporates have less urgency to buy their typical downside protection in EUR/USD. The demand for EUR puts has faded and actually the Risk Reversal skew is now flat out over the next ten years. This actually suggests buying downside EUR/USD protection is cheap, but again does not make the case for a EUR/USD rally.
Chart 2: EUR/USD rolling correlation with MSCI World equity index
Eurozone portfolio story doesn't look that bad for EUR
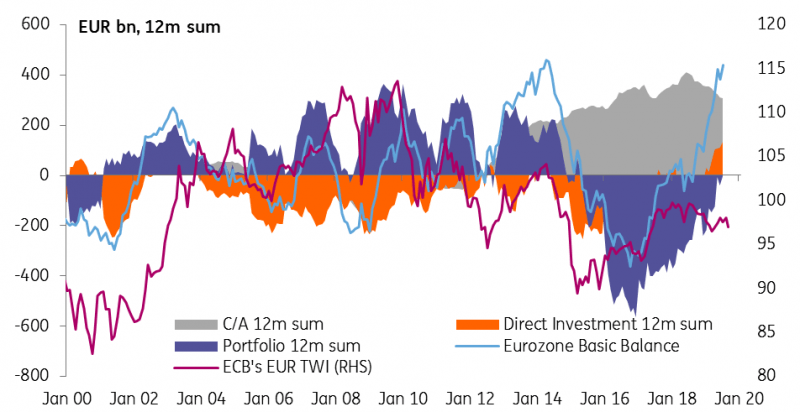
Away from the FX options market, the Eurozone Balance of Payments story should, in theory, be a little more positive for the EUR. The Eurozone still runs a large current account surplus (2.7% of GDP) and instead of this being re-cycled out of the Eurozone via Direct Investment and Portfolio outflows – which was certainly the case over the last couple of years – these outflows have declined markedly.
For example, on a twelve-month basis Eurozone direct investment outflows of EUR180bn have reversed to EUR85bn of inflows over the last year. EUR211bn of portfolio investment outflows have reversed to EUR15bn of inflows over the period. We'd characterise most of this activity as ‘de-leveraging', where Eurozone residents have cut overseas investments in a more significant number than foreigners have cut investments in the Eurozone. In theory that should have been positive for the EUR, but it clearly hasn't. We think ‘hot money' or short-term money market flows explains a lot.
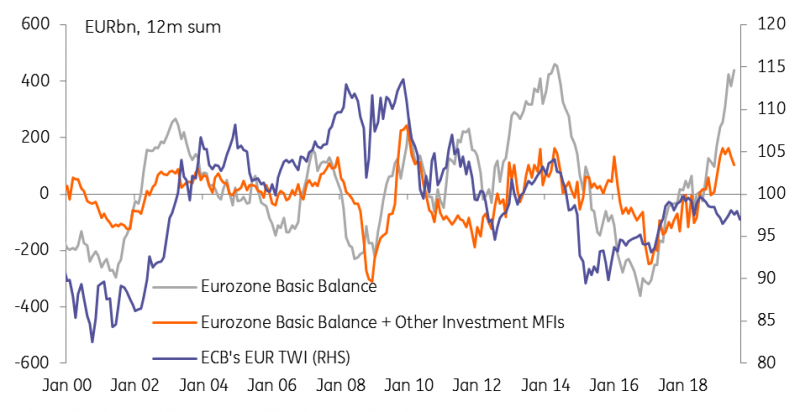
Chart 3: Eurozone Balance of Payments (EUR bn, 12m sum) versus EUR TWI
‘Hot Money' is swamping the Eurozone Balance of Payments story
Normally defined as fast-moving, short-term portfolio flows, eg. placed in short term deposits, ‘hot money' can define FX trends, but also mean that FX trends can quickly reverse. Typically a country running a large current account deficit would prefer the imbalance to be funded by long term, sticky direct investment, rather than hot money flows which can turn on a dime.
Typically it's quite hard to get a full gauge on these hot money flows, but some clues can be found in the Eurozone BoP data. Here we've said that the current account, plus direct and portfolio investment make a good story for the EUR – actually worth EUR400bn of inflows over the last twelve months. But also in the Financial account is a line item called ‘Other Investment, MFIs'. This represents private sector banks flow in areas like money markets. These Euro area banks have seen their foreign short-term assets grow by a staggering €350bn over the last year – nearly wiping out those other inflows. This has to be a function of the wide interest rate differentials at the short end of the curve.
Deposit flows out of the Eurozone offset other positives in the Balance of Payments
Read the original article: EUR: Misleading indicators, portfolio flows and hot money
Author

Chris Turner
ING Economic and Financial Analysis
Chris is Head of FX Strategy at ING. Together with his team, he provides short and medium-term FX recommendations for ING’s corporate and institutional client base.


