EUR/JPY stabilises a tad below 15-year highs [Video]
-
EURJPY stuck in a tight range during September.
-
Hovers just below 15-year peaks supported by 50-day SMA.
-
Momentum indicators tilt to the bullish side.
![EUR/JPY stabilises a tad below 15-year highs [Video]](https://editorial.fxstreet.com/images/Markets/Currencies/Crosses/EURJPY/computer-keyboard-with-currency-pair-eur-jpy-button-49017434_XtraLarge.jpg)
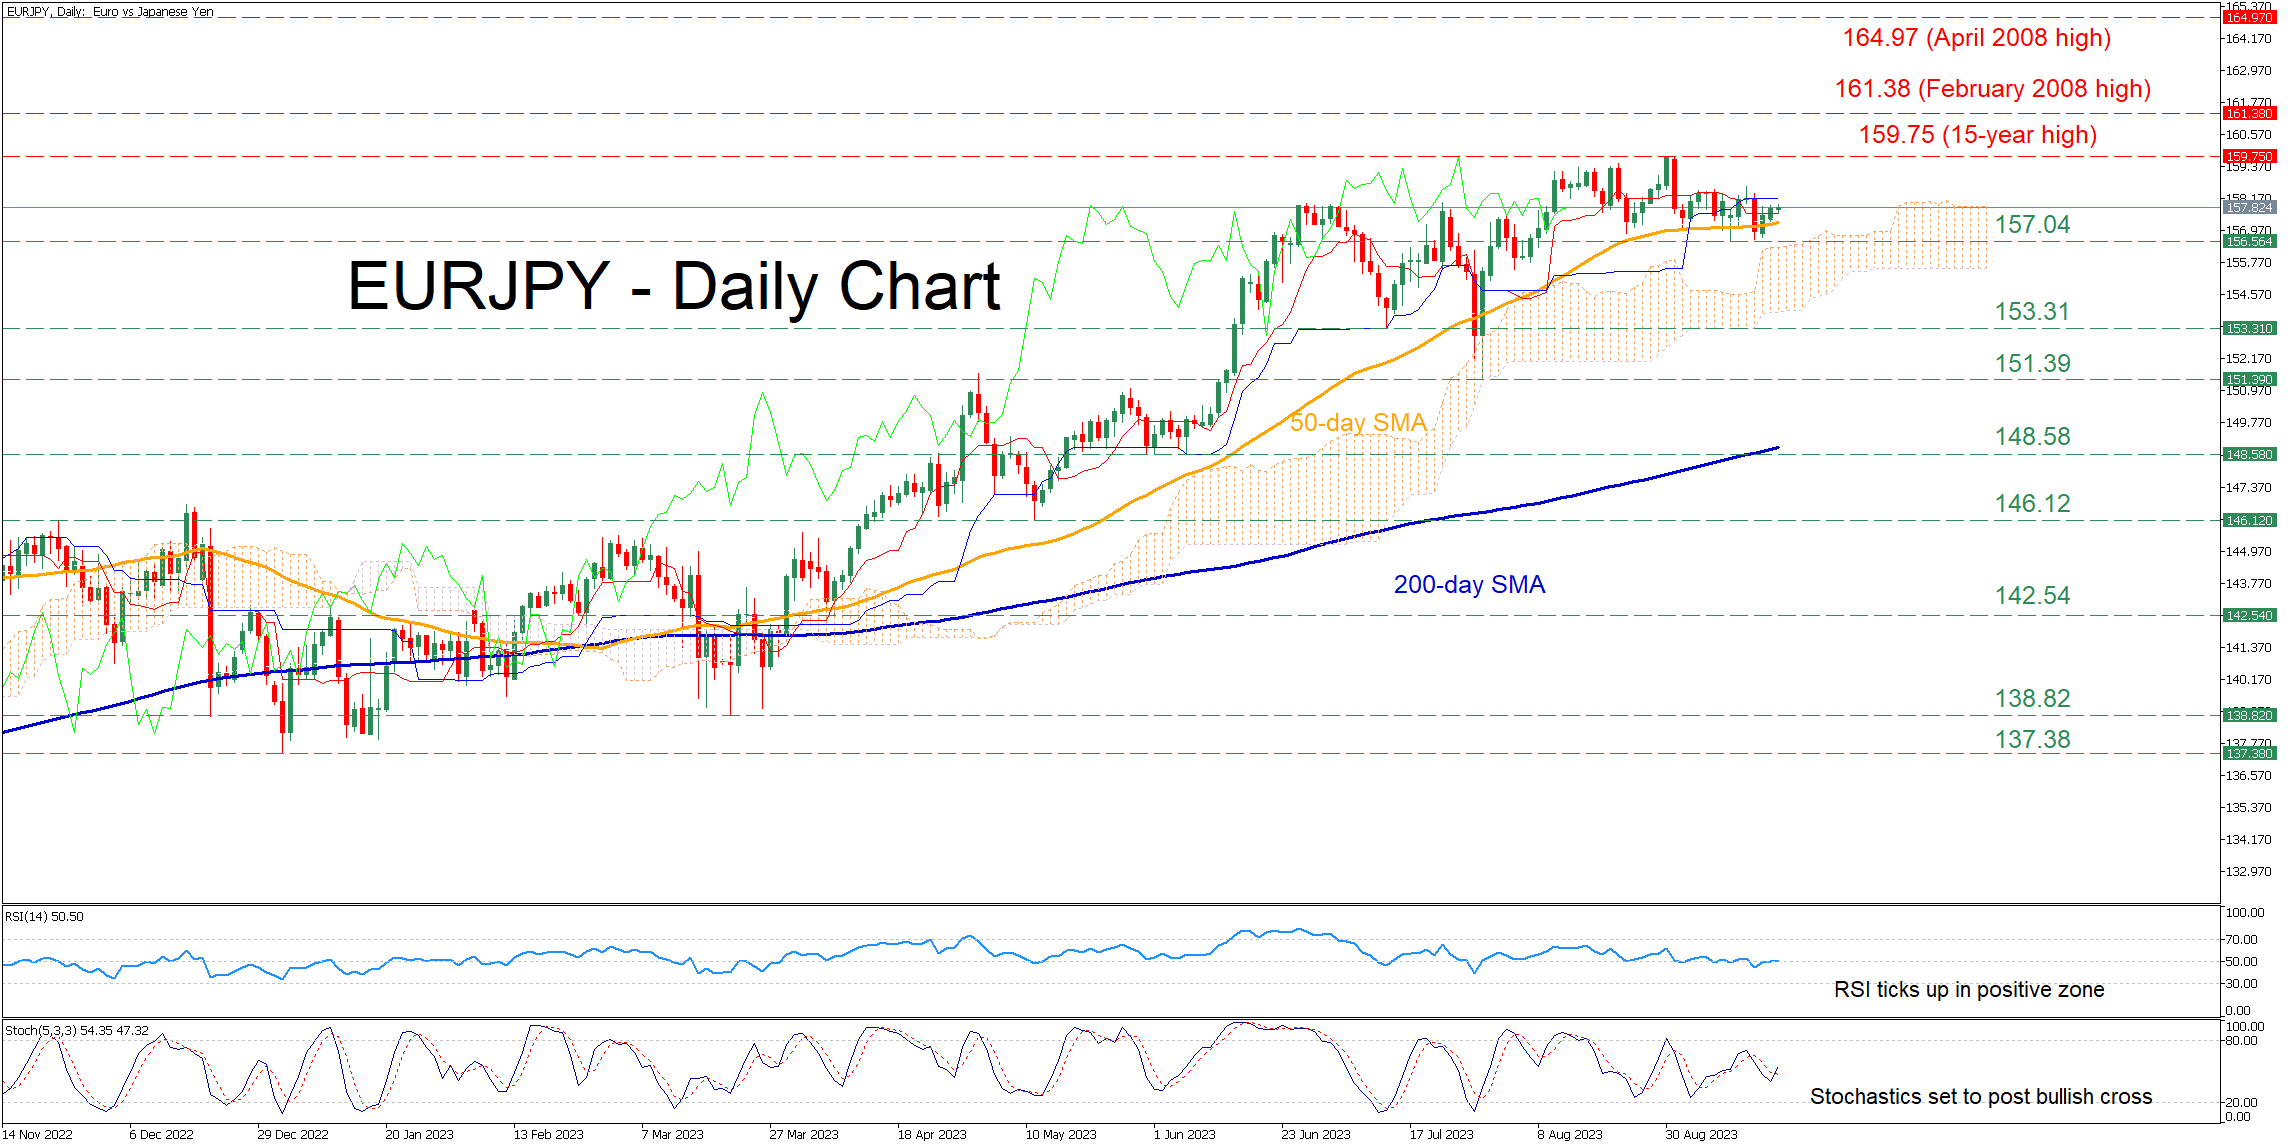
EURJPY has been in a prolonged uptrend since the beginning of the year, posting a fresh 15-year peak of 159.75 on August 31. Since then, the price has been trading without a clear direction around the 158.00 handle, while the short-term oscillators are reflecting a neutral-to-positive near-term bias.
If the sideways pattern breaks to the upside, the bulls might aim at the 15-year high of 159.75. Jumping above that zone, the pair could storm to fresh multi-year highs, where the February 2008 peak of 161.38 may curb further advances. Failing to halt there, the price might then ascend to challenge the April 2008 high of 164.97.
On the flipside, should the pair cross below the 50-day simple moving average (SMA), immediate support could be found at 157.04, which held strong twice in September. A violation of that zone could trigger a retreat towards 153.31. Even lower, the July bottom of 151.39 may prove to be a tough hurdle for the bears to overcome.
In brief, EURJPY has been silent for the past couple of weeks, appearing to be lacking directional impetus. Given that the short-term oscillators are indicating intensifying buying interest, can the pair revisit its recent multi-year highs?
Author

Stefanos joined XM as a Junior Investment Analyst in September 2021. He conducts daily market research on the currency, commodity and equity markets, from a fundamental and a technical perspective.


