EUR/JPY: Sellers’ domination continues

EUR/JPY, after having a rejection at the triple top, has been heading towards the South on the daily chart. The chart suggests that there is enough room for the price to continue its bearish journey. Moreover, yesterday’s candle came out as a bullish inside bar. Thus, if today’s candle comes out as a bearish engulfing candle, the sellers may keep going short on the pair and drive the price towards the next level of support. Two major intraday charts are bearish biased as well. Let us have a look at those three charts.
Chart 1 EUR/JPY Daily Chart
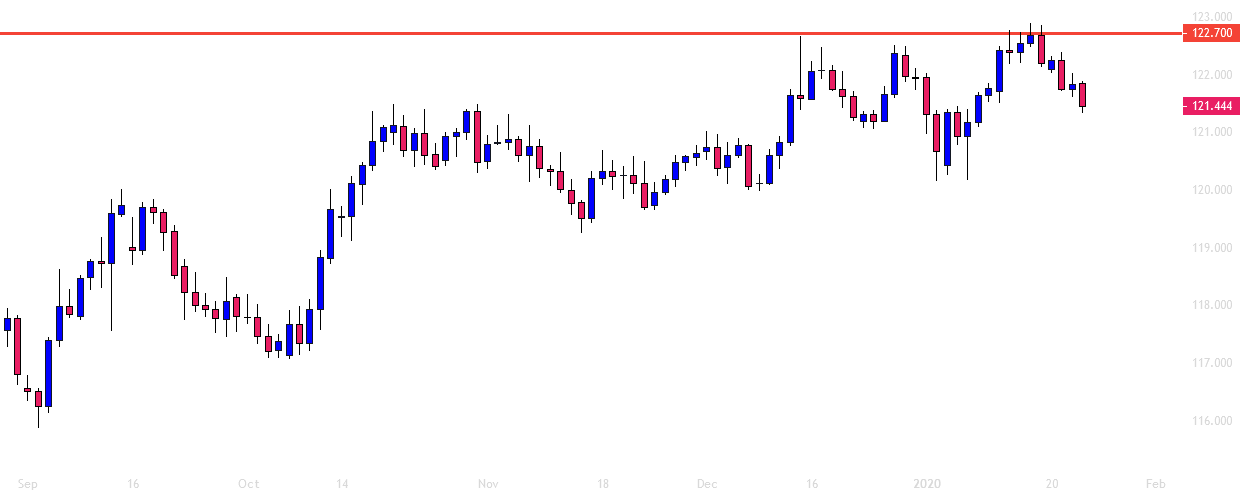
The chart shows that the price after producing a bearish engulfing candle at the level of 122.700 has produced three bearish candles. The price had its rejection at a strong resistance zone since it had rejection twice earlier. The price may find its next support at the level of 120.125. This allows the sellers to have enough space to ride on the potential bearish wave. The day before yesterday’s daily candle came out as a strong bearish candle followed by a bullish inside bar. Thus, if today’s candle closes below yesterday’s lowest low, the sellers may go short on the pair aggressively.
Chart 2 EUR/JPY H4 Chart
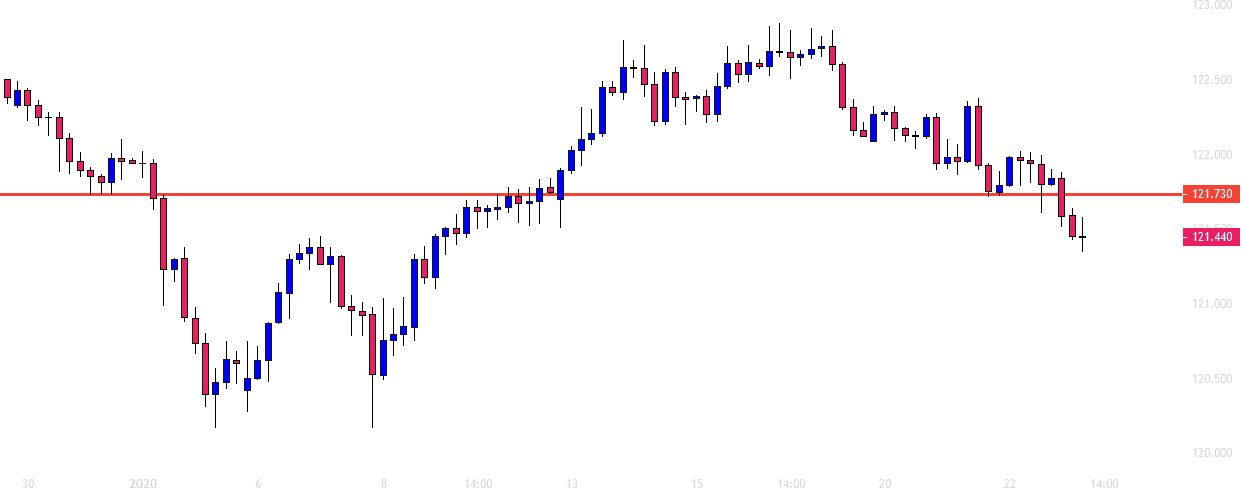
The chart shows that it made a breakout at the level of 121.730 and traded for one more candle. This is an ideal chart for the sellers to go short on the pair. The price may head towards the level of 120.500 without having that many pauses. On the other hand, if it consolidates, it may find its resistance at the level of 121.730. The sellers are to wait for a bearish reversal candle to go short below the level of 121.300.
Chart 3 EUR/JPY H1 Chart
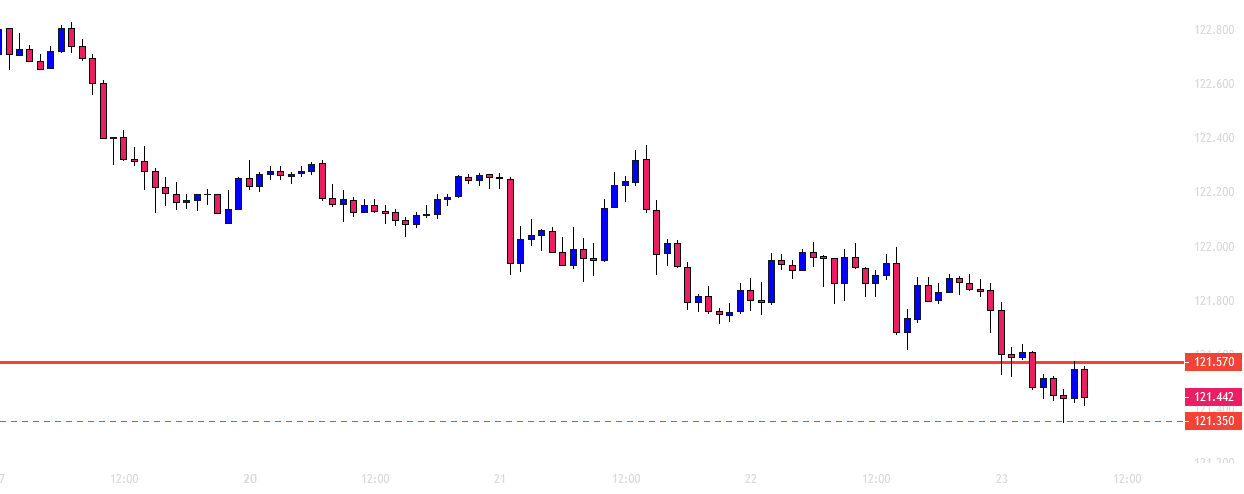
The chart shows that the price has been on consolidation after being bearish. The level of 121.570 may work as the level of resistance. As of writing, the last candle has been bearish. If it ends up being a bearish candle, the sellers may go short below the level of 121.350. The price may find its next resistance at the level of 121.000.
The daily, the H4, as well as the H1 chart, look very good for the sellers. Among them, the H4 chart looks more bearish than the other two. The H1 chart may get bearish anytime soon. Thus, it may be another bearish day. The daily traders are to keep an eye on the pair, whether the candle closes below the level of resistance having a tiny lower shadow.
Author

EagleFX Team
EagleFX
EagleFX Team is an international group of market analysts with skills in fundamental and technical analysis, applying several methods to assess the state and likelihood of price movements on Forex, Commodities, Indices, Metals and


