EUR/JPY: Market patterns continue to call the move higher

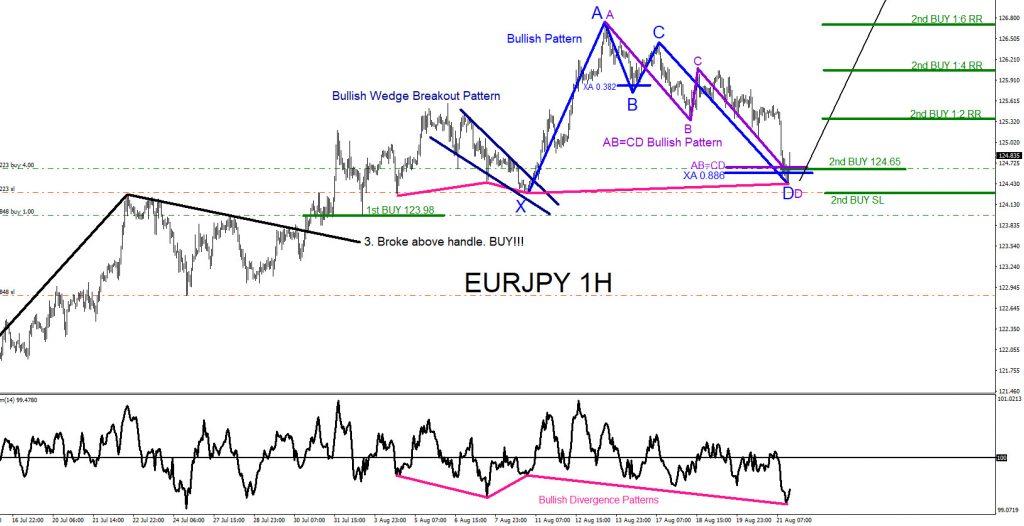
The chart below was also posted on social media StockTwits/Twitter @AidanFX August 21 2020 showing that bullish market patterns were visible on the 1 hour chart calling for a move higher. Bullish Pattern (blue) triggered BUYS at the XA 0.886 Fib. retracement level and the bullish AB=CD pattern (purple) triggered BUYS at the AB=CD level. I called for traders to add EURJPY LONGS/BUYS with a tight stop loss at the point X of the blue bullish pattern. Bullish divergence pattern (pink) added more confirmation to enter the 2nd BUY. 2nd BUY entry triggered at 124.65 with stop loss at 124.30.
EUR/JPY 1 Hour Chart August 21 2020
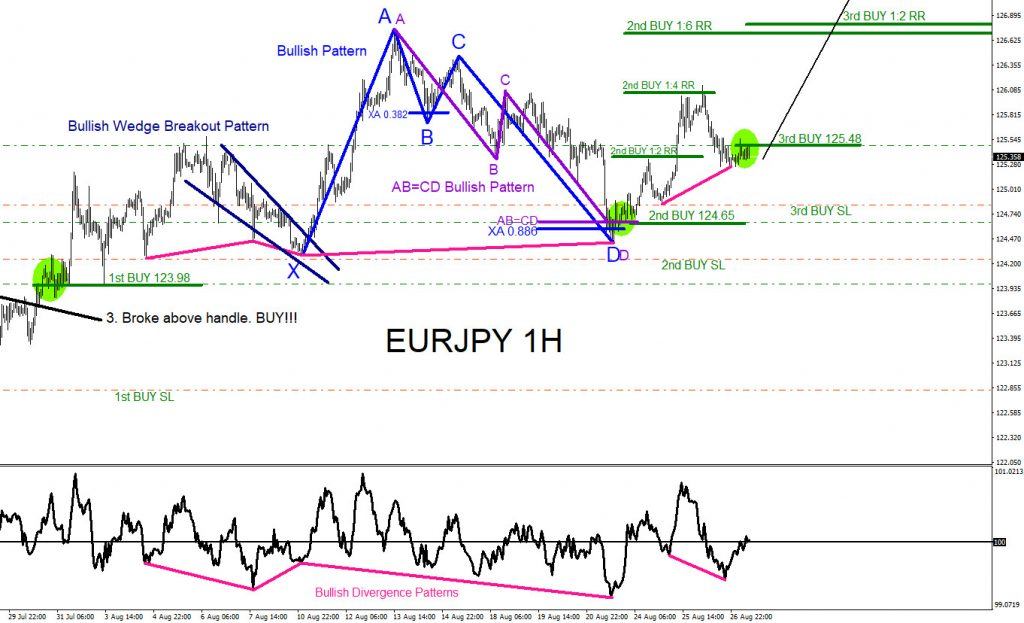
The pair pushed higher and hit the 1:4 RR 2nd BUY target. A trend continuation divergence pattern (pink) formed on the pullback after hitting the 1:4 RR target which signalled more upside was still in the works and to hold on to 2nd LONGS/BUYS. Also entered 3rd LONG/BUY at 125.48 with stops at 124.83 looking for a 1:2 RR Target
EUR/JPY 1 Hour Chart August 27 2020
The pair eventually rallied higher and hit the 1:6 RR 2nd BUY target at 126.75 from 124.65 for +210 pips and hit the 1:2 RR 3rd BUY target at 126.78 from 125.48 for +130 pips. Combined total +340 pips and still holding 1st EURJPY 123.98 BUY entry.
Author

Elliott Wave Forecast Team
ElliottWave-Forecast.com


