EUR/GBP Elliott Wave technical analysis [Video]
![EUR/GBP Elliott Wave technical analysis [Video]](https://editorial.fxstreet.com/images/Markets/Currencies/Crosses/EURGBP/display-stock-market-data-28943278.jpg)
EURGBP Elliott Wave Analysis Trading Lounge.
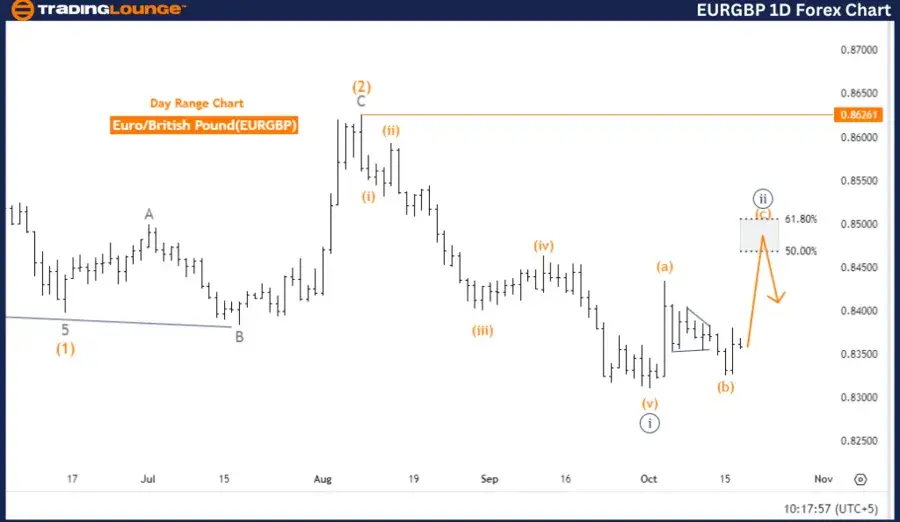
Euro/British Pound (EURGBP) Day Chart.
EUR/GBP Elliott Wave technical analysis
-
Function: Counter Trend.
-
Mode: Corrective.
-
Structure: Navy Blue Wave 2.
-
Position: Gray Wave 1.
-
Direction next lower degrees: Navy Blue Wave 3.
-
Details: Navy Blue Wave 1 is now completed, and Navy Blue Wave 2 is currently unfolding.
-
Wave cancel invalidation level: 0.86261.
The EURGBP daily chart Elliott Wave analysis shows that the market is presently in a corrective counter-trend phase. The analysis highlights the formation of Navy Blue Wave 2, with Gray Wave 1 already completed. This corrective wave suggests a temporary pullback before the main trend resumes.
With Navy Blue Wave 1 completed, the initial impulsive move has concluded. Now, Navy Blue Wave 2 is active, marking a corrective phase within the larger structure. This wave represents a pause or retracement in the broader trend, likely before the market resumes in the direction of Navy Blue Wave 3, signaling the continuation of the primary trend.
The next anticipated movement in the lower degrees points to the development of Navy Blue Wave 3 after Navy Blue Wave 2 completes. This wave is expected to initiate another impulsive movement aligned with the main trend. Until then, the market is likely to remain in this corrective phase.
The invalidation level for this wave count is set at 0.86261. A move below this level would invalidate the current wave structure and require a reassessment of the analysis. As long as the market stays above this level, the wave count remains intact, and Navy Blue Wave 2 is expected to conclude, leading to the beginning of Navy Blue Wave 3.
Summary:
EURGBP is in a corrective counter-trend phase, with Navy Blue Wave 2 in progress following the completion of Navy Blue Wave 1. The next expected movement is the development of Navy Blue Wave 3, with the invalidation level at 0.86261.
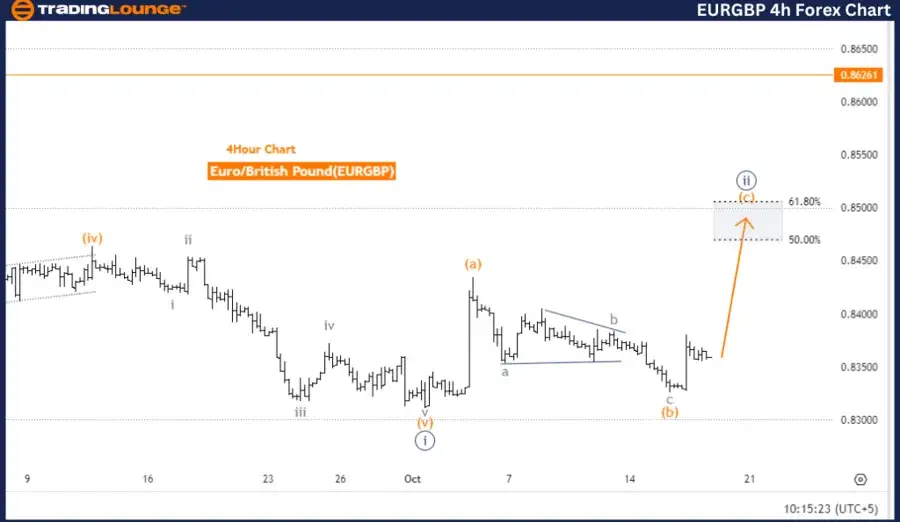
Euro/British Pound (EURGBP) 4 Hour Chart.
EUR/GBP Elliott Wave technical analysis
-
Function: Counter Trend.
-
Mode: Impulsive as Wave C.
-
Structure: Orange Wave C.
-
Position: Navy Blue Wave 2.
-
Direction next lower degrees: Navy Blue Wave 3.
-
Details: Orange Wave B of Navy Blue Wave 2 has completed, and now Orange Wave C of 2 is unfolding.
-
Wave cancel invalidation level: 0.86261.
The EURGBP 4-hour chart Elliott Wave analysis highlights a counter-trend movement currently developing. The analysis identifies an impulsive wave in Orange Wave C, which is part of the corrective structure within Navy Blue Wave 2. This indicates that the market is in a temporary corrective phase before possibly resuming the main trend.
The current structure centers on Orange Wave C, which follows the completion of Orange Wave B within Navy Blue Wave 2. The completion of Orange Wave B marks the end of the corrective bounce within the broader corrective structure, and now Orange Wave C has commenced, moving towards completing Navy Blue Wave 2. This suggests that the market is in the final stages of this correction, and once Orange Wave C concludes, a reversal into Navy Blue Wave 3 is expected, potentially resuming the primary trend.
The next move in the lower degrees points towards the development of Navy Blue Wave 3 once Orange Wave C is finished. This wave is expected to trigger a new impulsive movement in line with the overall trend as the correction concludes.
The invalidation level for this wave count is set at 0.86261. If the market price drops below this level, the current wave structure would be invalidated, and the analysis would need to be revised. As long as the price stays above this level, the wave count remains valid, and the expectation of Orange Wave C completing remains intact.
Summary:
EURGBP is in a corrective counter-trend phase with Orange Wave C currently unfolding. Once this wave concludes, the start of Navy Blue Wave 3 is anticipated, signaling a potential resumption of the primary trend. The invalidation level for this analysis is 0.86261.
Technical analyst: Malik Awais.
EUR/GBP Elliott Wave technical analysis [Video]
Author

Peter Mathers
TradingLounge
Peter Mathers started actively trading in 1982. He began his career at Hoei and Shoin, a Japanese futures trading company.


