EUR/GBP Elliott Wave technical analysis [Video]
![EUR/GBP Elliott Wave technical analysis [Video]](https://editorial.fxstreet.com/images/Markets/Currencies/Crosses/EURGBP/eurgbp_XtraLarge.jpg)
EUR/GBP Elliott Wave technical analysis
Function: Trend.
Mode: Impulsive.
Structure: Orange wave 1.
Position: Navy blue wave 3.
Direction next higher degrees: Orange wave 2.
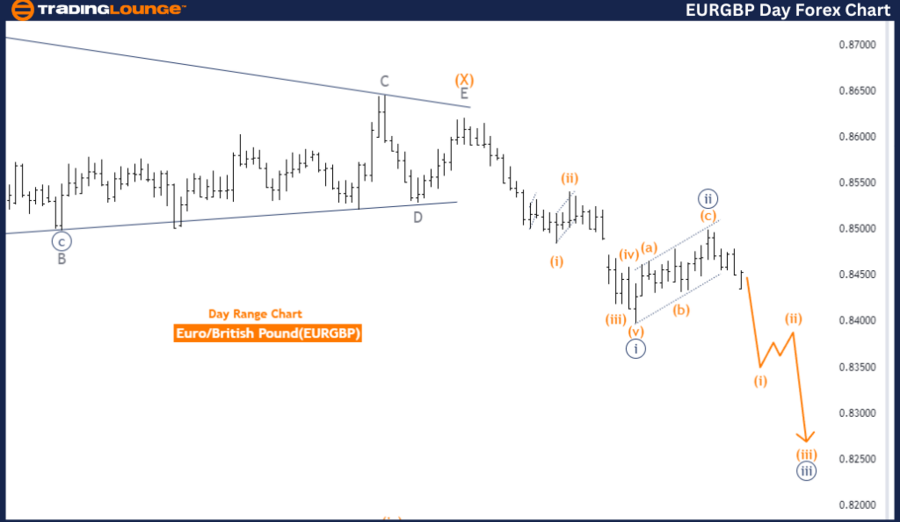
Details: Navy blue wave 2 looking completed at 0.84994, now orange wave 1 of 3 is in play. Wave Cancel invalid level: 0.84994.
The EURGBP Elliott Wave Analysis on the daily chart focuses on identifying the trend and wave structure of the Euro against the British Pound. This analysis is geared towards capturing the ongoing trend, which is classified as impulsive, indicating a strong directional movement and suggesting the continuation of the current trend.
Key points
-
The specific wave structure under scrutiny is orange wave 1.
-
The current position within this structure is navy blue wave 3, signifying that the market is in an advanced stage of a larger impulsive wave sequence.
-
This stage is crucial as it typically denotes a significant and powerful market movement.
The analysis points out that navy blue wave 2 appears to be completed at the level of 0.84994. This completion is a vital phase in Elliott Wave theory, as it follows a corrective move and precedes a substantial impulsive move. With navy blue wave 2 concluded, the market is now in orange wave 1 of 3. This phase is critical as it generally involves a strong and extended movement in the direction of the overall trend.
Next steps
-
The direction in the next higher degrees indicates the formation of orange wave 2.
-
This suggests that after the completion of the current impulsive wave (orange wave 1), the market will enter a corrective phase (orange wave 2).
-
However, the immediate focus remains on the development and progression of orange wave 1.
The wave cancel invalid level is set at 0.84994. This level is essential for maintaining the validity of the current wave structure. If the market surpasses this threshold, the existing wave count would be invalidated, necessitating a re-evaluation and potential re-labeling of the wave counts.
Summary
-
The EURGBP daily chart analysis indicates that the market is in an impulsive trend with orange wave 1 currently unfolding within navy blue wave 3.
-
The analysis suggests that navy blue wave 2 has been completed at 0.84994, and orange wave 1 of 3 is now in play.
-
The focus is on the continuation of this impulsive movement, with the wave cancel invalid level set at 0.84994.
-
This analysis underscores the potential for further upward movement in the EURGBP currency pair.
EUR/GBP day chart
EUR/GBP Elliott Wave technical analysis
Function: Trend.
Mode: Impulsive.
Structure: Gray wave 3.
Position: Orange wave 1.
Direction next higher degrees: Gray wave 4.
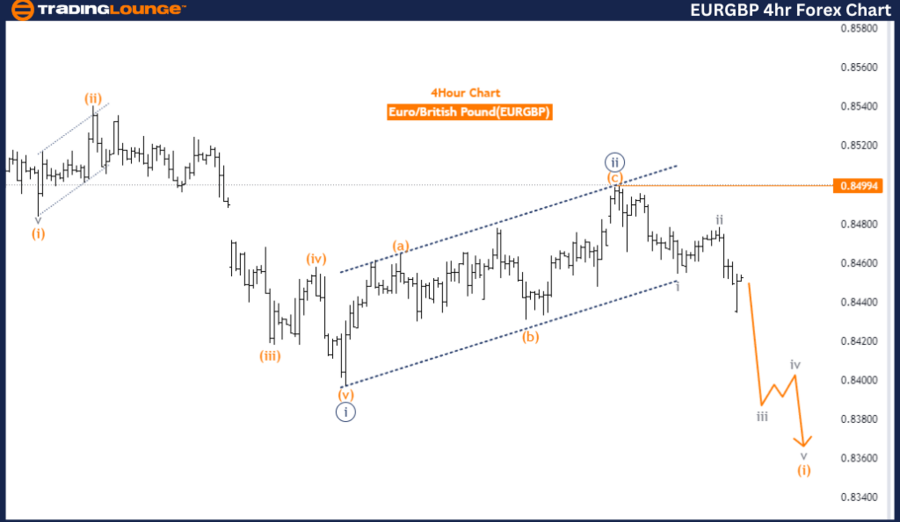
Details: Gray wave 2 looking completed, now gray wave 3 of 1 is in play. Wave Cancel invalid level: 0.84994.
The EURGBP Elliott Wave Analysis on the four-hour chart aims to identify the current trend and wave structure of the Euro against the British Pound. This analysis is primarily focused on capturing the trend, which is classified as impulsive. An impulsive mode indicates a strong directional move, suggesting the continuation of the current trend.
Key points
-
The specific wave structure under analysis is gray wave 3.
-
The position within this structure is orange wave 1, indicating that the market is in the early stages of a larger impulsive wave sequence.
-
This stage is significant as it typically marks the beginning of a powerful and sustained market movement.
The analysis points out that gray wave 2 appears to be completed. This completion is a critical phase in Elliott Wave theory as it follows a corrective move and precedes a significant impulsive move. With gray wave 2 concluded, the market is now in gray wave 3 of 1. This phase is crucial as it typically involves a strong and extended movement in the direction of the overall trend.
Next steps
-
The direction in the next higher degrees points towards gray wave 4.
-
This suggests that after the completion of the current impulsive wave (gray wave 3), the market will enter a corrective phase (gray wave 4).
-
However, the immediate focus remains on the progression of gray wave 3.
The wave cancel invalid level is set at 0.84994. This level is essential for maintaining the validity of the current wave structure. If the market surpasses this threshold, the existing wave count would be invalidated, requiring a re-evaluation and potential re-labeling of the wave counts.
Summary
-
The EURGBP four-hour chart analysis indicates that the market is in an impulsive trend with gray wave 3 currently unfolding within orange wave 1.
-
The analysis suggests that gray wave 2 has been completed, and gray wave 3 of 1 is now in play.
-
The focus is on the continuation of this impulsive movement, with the wave cancel invalid level set at 0.84994.
-
This analysis highlights the potential for further upward movement in the EURGBP currency pair.
EUR/GBP four-hour chart
EUR/GBP Elliott Wave technical analysis [Video]
Author

Peter Mathers
TradingLounge
Peter Mathers started actively trading in 1982. He began his career at Hoei and Shoin, a Japanese futures trading company.


