EUR/CHF: The Euro swiss pair bouncing from weekly blue box

In the present article, we are going to take a look on the weekly chart of EURCHF: Euro Swiss forex pair. In a quiet natural way, this cross is a ratio of two pairs: EURUSD and USDCHF. Even though, both dollar linked pairs are by far more liquid instruments, the EURCHF shows its own character. Indeed, from January 2015 lows it develops a clean double three structure and follows hereby Fibonacci extension levels.
In our initial article from March 2020, we have forecasted another bullish cycle after 7 swings lower. As a matter of fact, the market has provided a short term bounce and correction continued as a larger 7 swings structure. Here, we take a view on EURCHF pattern in the past 8 years and provide an outlook with targets for coming 3-5 years.
EUR/CHF weekly Elliott Wave analysis 01.24.2023
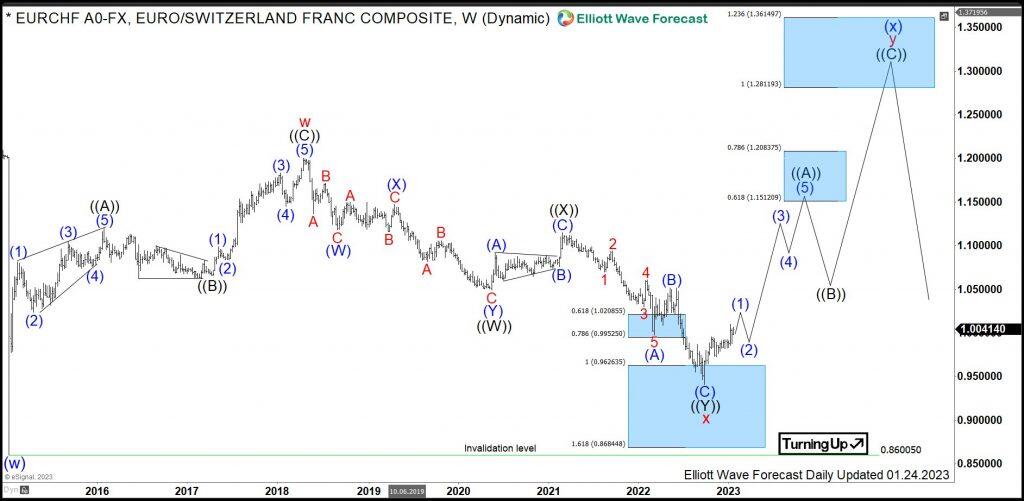
The weekly chart below shows the price behavior of the cross ratio EURCHF. From the lows of January 2015, the pair has developed a cycle higher in red wave x of a cycle degree. It has printed the highs in April 2018 at 1.2005. The advance is an Elliott wave zigzag pattern being a 3 swings corrective structure. Generally speaking, the correction might be over after 3 swings already. However, in contrast to stocks, forex is a range bound market. Therefore, the latter can trend also in corrective sequences.
From April 2018 highs, a correction lower in wave x has unfolded as a double three pattern being 3- 3-3 structure. First, wave ((W)) has ended in May 2020 at 1.0492 lows. Then, a connector in wave ((X)) has printed a lower high in March 2021 at 1.1151. From there, wave ((Y)) has developed another 3 swings to the downside. Hereby, blue wave (A) of black wave ((Y)) has reached 1.0208- 0.9952 intermediary range being 0.618-0.786 extension area. After a bounce in wave (B), the final swing in blue wave (C) of black wave ((Y)) has reached 0.9626-0.8684 full extension area. From that area, a strong reaction higher can be seen. Now, the bottom at 0.9407 lows is favored to be the end the entire correction of cycle from January 2015 lows.
From the September 2022 lows, EURCHF might be in the first stages of a new cycle in red wave y. While above 0.9407 lows, pair can reach in 3 swings 1.2811-1.4914 area. Hereby, intermediary area 1.1512-1.2083 should provide medium term resistance.
Author

Elliott Wave Forecast Team
ElliottWave-Forecast.com


