EUR/CHF: Daily bearish engulfing candle makes it look good for the sellers
EUR/CHF produced consecutive two bearish candles on the daily chart. The first candle came out as a bearish engulfing candle, and the second one came out as a bearish Marubozu candle. The last swing low is far enough, which allows the price to travel a good distance towards the downside. Major intraday charts look good for the sellers as well. Thus, the pair may end up having another bearish day.
Chart 1 EUR/CHF Daily Chart
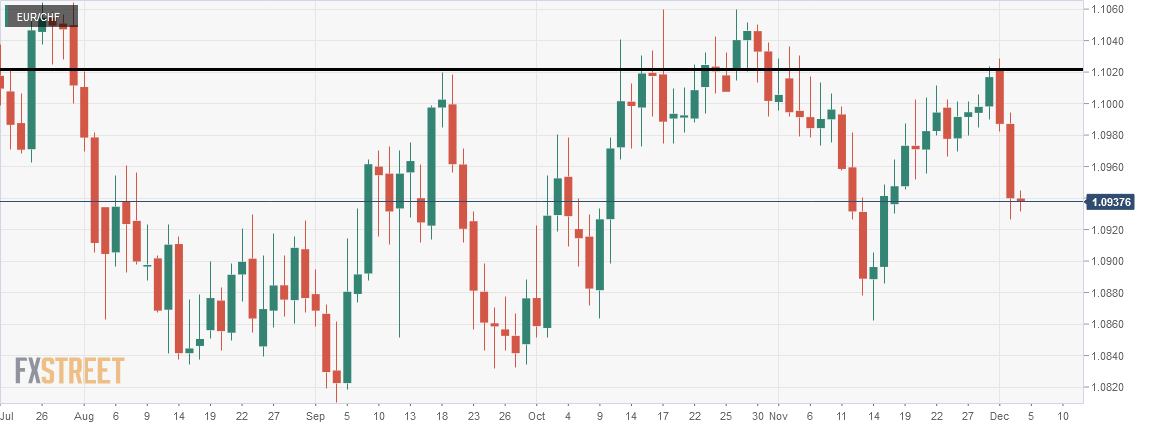
The chart shows that the price after finding its resistance at the level of 1.1020 produced a bearish daily engulfing candle. The next candle came out bearish as well. That one is even a bigger candle than the first one. The last swing low is at the level of 1.0860. This means the price has a lot of space towards the South to travel. It offers a bit less than 1:1 risk-reward to the sellers. However, major intraday charts look more lucrative for the sellers. Let us have a look at those.
Chart 2 EUR/CHF H4 Chart
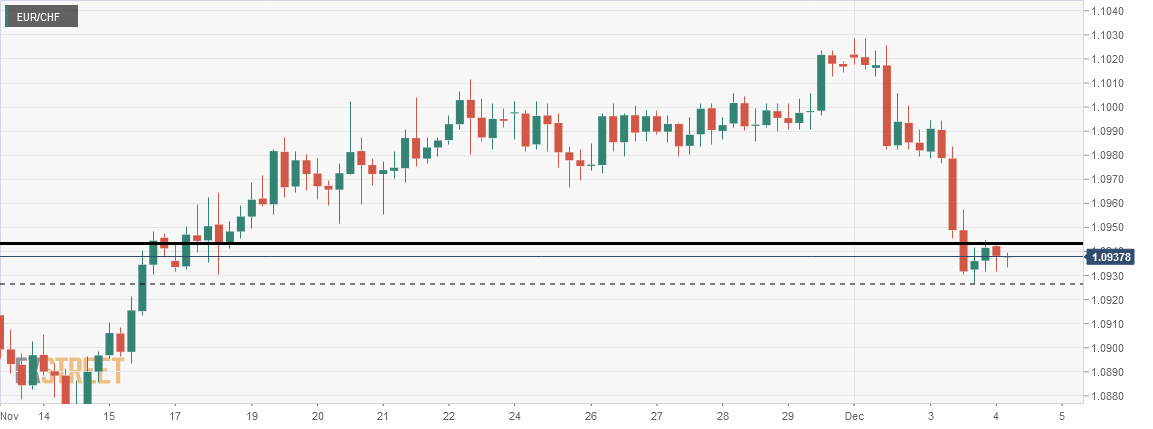
The price after being very bearish has had a bounce at the level of 1.0925. It has been on consolidation now. It finds its resistance at the level of 1.0943. If the level produces an H4 bearish engulfing candle breaching yesterday’s lowest low, the H4 sellers may go short up to the level of 1.0892. In contrast, if the level gets breached on the H4 chart, the price may find its next resistance at the level of 1.0970. The sellers then may have to wait long to go short with good risk-reward.
Chart 3 EUR/CHF H1 Chart
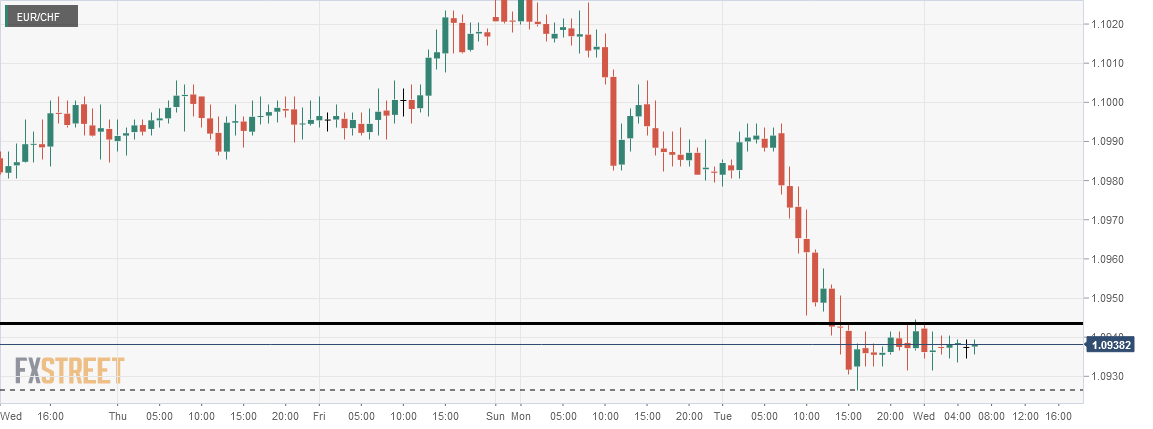
The H1 chart shows that the price has been ranging. The price has had rejection at the resistance level several times. However, no strong bearish momentum has been created yet. The price may go to the resistance to create good bearish pressure and makes a breakout at the level of support. The H1 chart shows that the price may find its next resistance at the level of 1.0980, which offers better risk-reward to the H1 buyers than it does to the H4 traders.
The daily and H4 charts look lucrative for the sellers. The H1 chart looks lucrative to both. Considering overall bearish pressure, the H1 sellers may have the upper hand. If the H1 chart makes the downside breakout, most likely, the pair gets a very bearish day today.
Author

EagleFX Team
EagleFX
EagleFX Team is an international group of market analysts with skills in fundamental and technical analysis, applying several methods to assess the state and likelihood of price movements on Forex, Commodities, Indices, Metals and


