EUR/CAD: support zone to push the price upside
EUR/CAD produced a doji candle with a long lower shadow on the daily chart at a support zone. The price upon finding its intraday support may make a breakout at Friday’s highest high and head towards the North. Major intraday charts are driving the price towards the South. The way the price has been moving downside, it seems that the sellers are not confident. The intraday buyers may want to go long on the pair if they get bullish breakout at the last swing high.
Chart 1 EUR/CAD Daily Chart
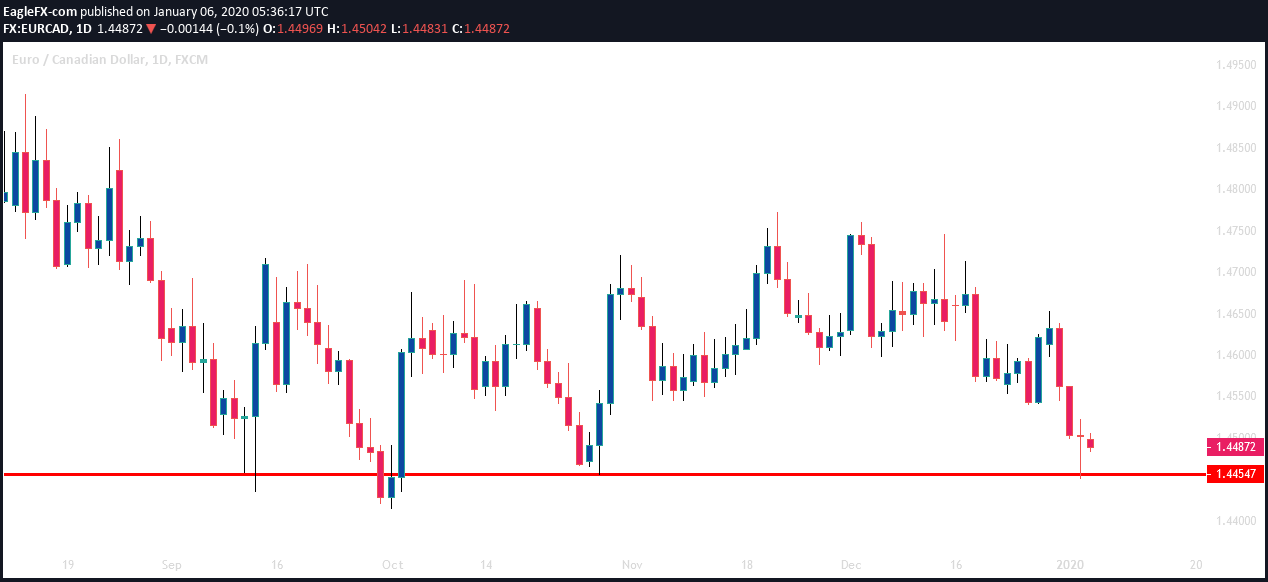
The chart shows that the price had several bounces at around the level of 1.44547. Last Friday’s candle came out as a doji candle, having a long lower shadow. It suggests that the sellers came out with their profit. If today’s daily candle closes above Friday’s candle, the buyers may look for buying opportunities on the pair. The price may find its next resistance at the level of 1.46340. If it breaches the level (1.46340), it may head towards the level of 1.47450 to find its resistance.
Chart 2 EUR/CAD H4 Chart
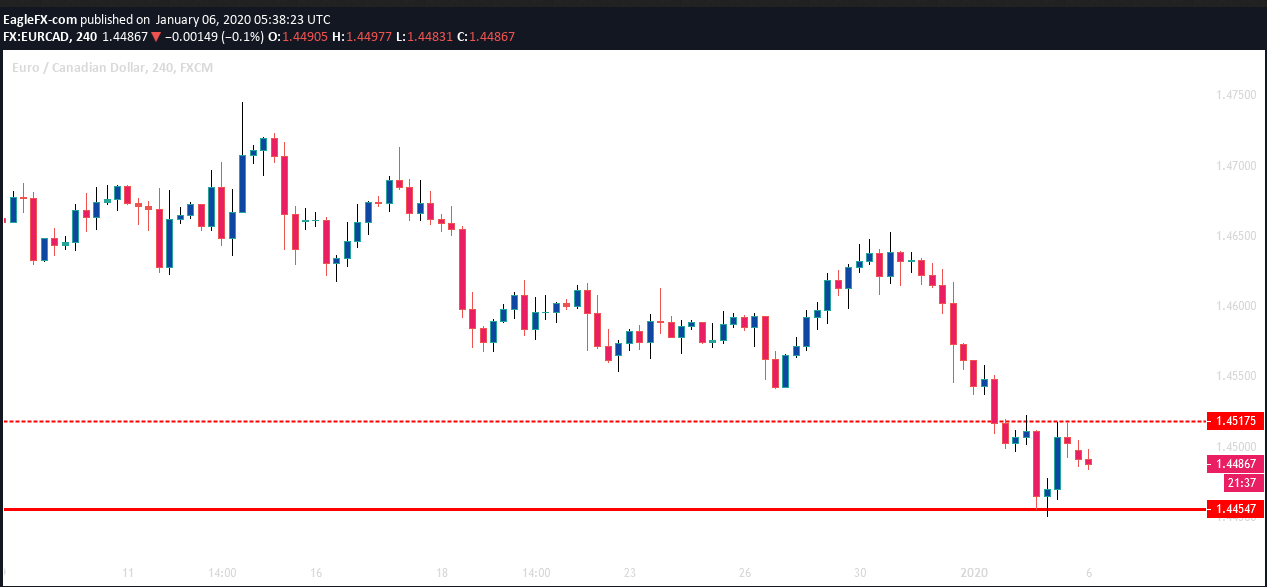
The H4 chart shows that it produced a morning star at the level of support. The price went up to the level of 1.45175 and had a rejection. Having rejected at the resistance, it has produced three consecutive bearish candles. The bodies of the last three candles suggest that the price is still bullish biased. The buyers may get themselves engaged in buying the pair upon a breakout at the level of 1.45175. If the price keeps going towards the downside, it may find its support at the level of 1.44547 again. The H4 sellers may not find it appealing to go short unless the price makes a bearish breakout at the level of support.
Chart 3 EUR/CAD H1 Chart
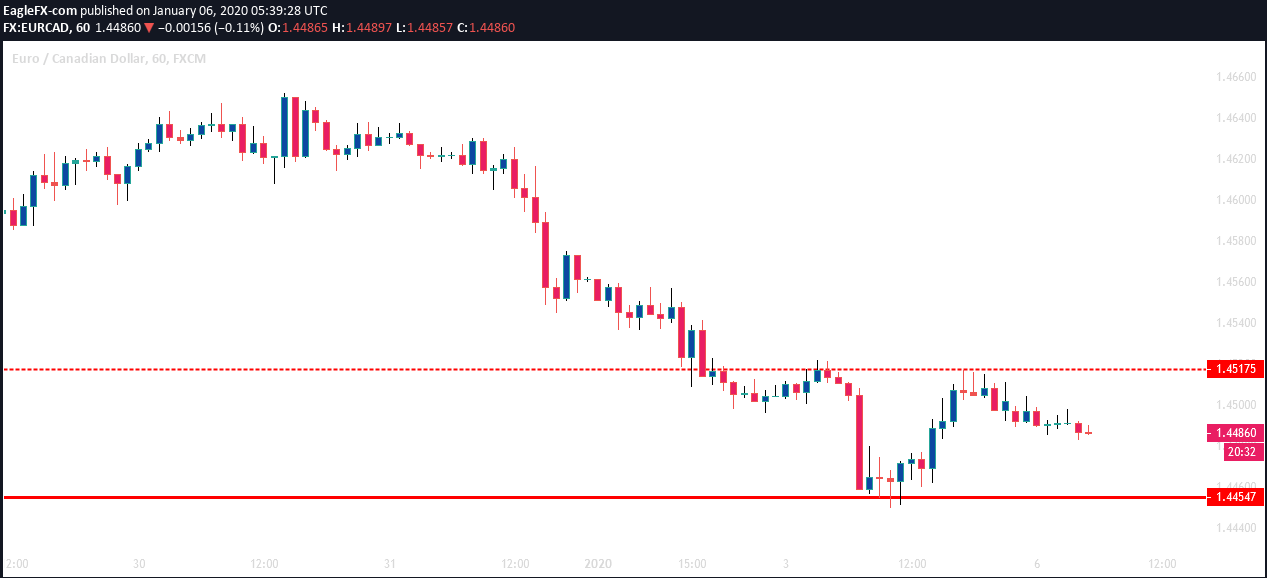
The H1 chart shows that the price produced a double top. However, the last bearish wave has not created good bearish momentum yet. The buyers are to wait for a breakout at the level of 1.45175. On the other hand, the sellers are to wait for a bearish breakout at the level of 1.44547. The price is in the middle. Thus, H1 traders may want to wait for a breakout to get themselves busy with the pair.
The daily and the H4 chart look good for the buyers. The H1 chart looks neutral. However, daily support zone and long-legged doji candle may push the price towards the North and make the pair bullish in coming days.
Author

EagleFX Team
EagleFX
EagleFX Team is an international group of market analysts with skills in fundamental and technical analysis, applying several methods to assess the state and likelihood of price movements on Forex, Commodities, Indices, Metals and


