|

EUR/CAD buying the dips at the blue box area

In this technical article we’re going to take a quick look at the Elliott Wave charts of EURCAD published in members area of the website.  As our members know, the pair is showing bullish sequences in the cycle from the August 2022 low.  Our team recommended members to avoid selling , while keep favoring the long side.  Recently we got correction that reached our buying zone. The pair found buyers and made rally from the blue box as expected. In the further text we are going to explain the Elliott Wave Forecast and trading strategy.

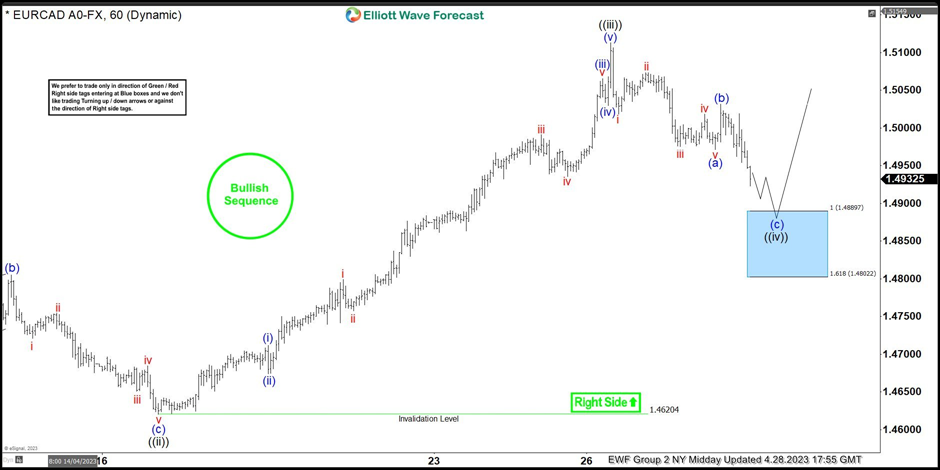
EUR/CAD Elliott Wave 1 hour chart 04.28.2023

The pair is giving us wave ((iv)) pull back that is unfolding as Zig Zag pattern. We expect to get more short term weakness toward 1.4889-1.4802 area which will be our buying zone. We don’t recommend selling the pair against the main bullish trend. Strategy is waiting for the price to reach blue box- equal legs zone, before entering the long trades again.  Once bounce reaches 50 Fibs against the (b) blue high , we will make long position risk free ( put SL at BE) and take partial profits. Invalidation for the long trades is break of 1.618 fib ext : 1.4802.

Chart

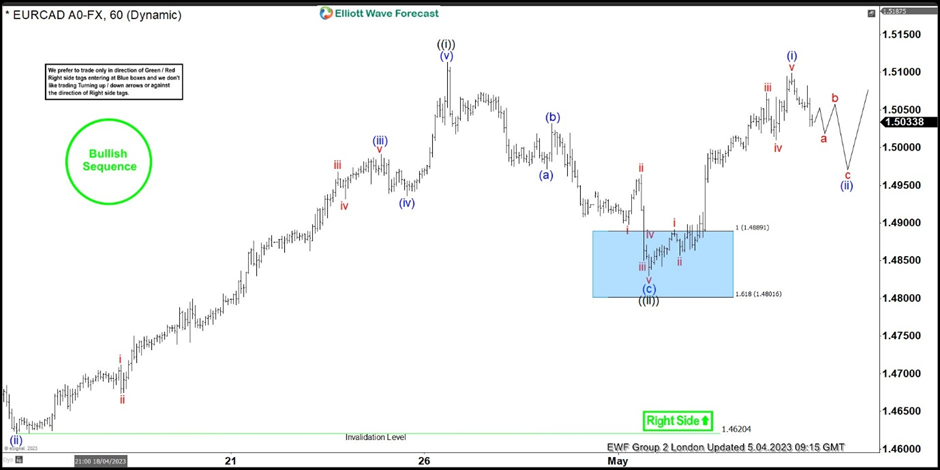
EUR/CAD Elliott Wave 1 hour chart 05.04.2023

EURCAD made decline in (c) leg and reached buying zone at 1.4889-1.4802 area( blue box) . Pull back completed at the 1.4841 low and we got a  very good reaction from the buying zone. Members who took the long trade are enjoying profits now in a risk free positions. Currently EURCAD is giving us pull back against the 1.4841 low. If pivot at that low gives up, we can get a deeper pull back per alternative view.

Chart

Author

Elliott Wave Forecast Team

Elliott Wave Forecast Team

ElliottWave-Forecast.com

More from Elliott Wave Forecast Team
Share:

Editor's Picks

EUR/USD flirts with daily highs, retargets 1.1900

EUR/USD regains upside traction, returning to the 1.1880 zone and refocusing its attention to the key 1.1900 barrier. The pair’s slight gains comes against the backdrop of a humble decline in the US Dollar as investors continue to assess the latest US CPI readings and the potential Fed’s rate path.

GBP/USD remains well bid around 1.3650

GBP/USD maintains its upside momentum in place, hovering around daily highs near 1.3650 and setting aside part of the recent three-day drop. Cable’s improved sentiment comes on the back of the Greenback’s  irresolute price action, while recent hawkish comments from the BoE’s Pill also collaborate with the uptick.

Gold clings to gains just above $5,000/oz

Gold is reclaiming part of the ground lost on Wednesday’s marked decline, as bargain-hunters keep piling up and lifting prices past the key $5,000 per troy ounce. The precious metal’s move higher is also underpinned by the slight pullback in the US Dollar and declining US Treasury yields across the curve.

Crypto Today: Bitcoin, Ethereum, XRP in choppy price action, weighed down by falling institutional interest 

Bitcoin's upside remains largely constrained amid weak technicals and declining institutional interest. Ethereum trades sideways above $1,900 support with the upside capped below $2,000 amid ETF outflows.

Week ahead – Data blitz, Fed Minutes and RBNZ decision in the spotlight

US GDP and PCE inflation are main highlights, plus the Fed minutes. UK and Japan have busy calendars too with focus on CPI. Flash PMIs for February will also be doing the rounds. RBNZ meets, is unlikely to follow RBA’s hawkish path.

Ripple Price Forecast: XRP potential bottom could be in sight

Ripple edges up above the intraday low of $1.35 at the time of writing on Friday amid mixed price actions across the crypto market. The remittance token failed to hold support at $1.40 the previous day, reflecting risk-off sentiment amid a decline in retail and institutional sentiment.