EUR/AUD: the Bear making its move
EUR/AUD produced a daily bearish candle day before yesterday at a double top resistance. Yesterday’s candle came out as an inside bar. It suggests that the price may head towards the South today. Today’s price action on major intraday charts suggests that the bear may dominate in the pair on the daily chart. As of writing, the pair is trading below yesterday’s lowest low. Thus, any bearish breakout may attract the sellers to go short on the pair and drive the price towards the downside.
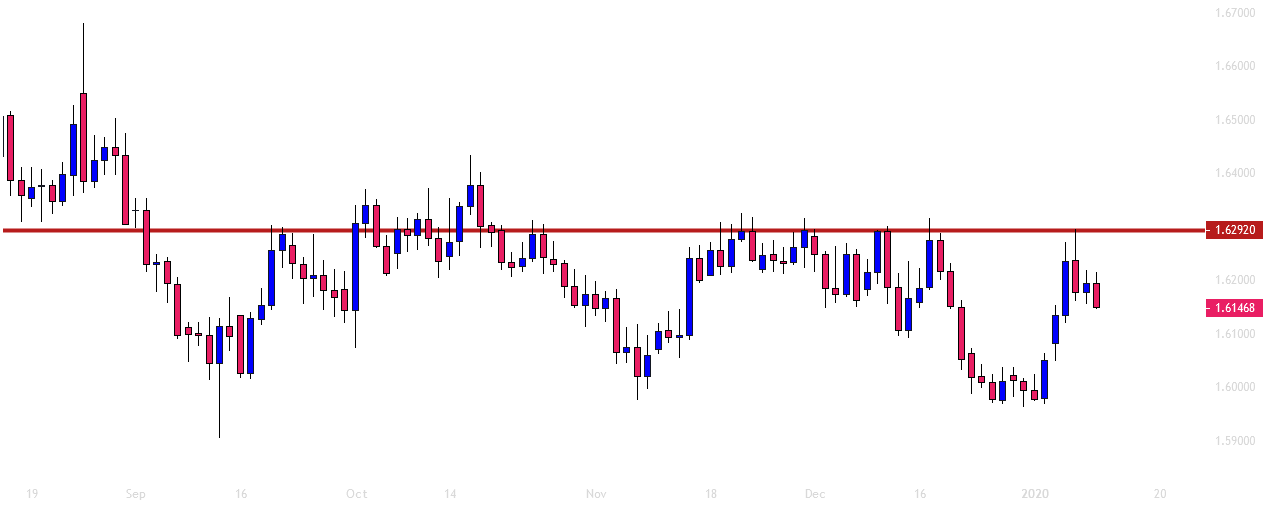
The chart shows that it produced a bearish inside bar at the level of 1.62920 day before yesterday. The price consolidated around this level for quite a while earlier and then made a bearish move. It went towards the level again. After having a rejection, it has been bearish-biased again. Yesterday’s bullish inside bar may attract the sellers to keep an eye on the pair to go short if today’s daily candle closes below its (yesterday’s daily candle) lowest low. The price may find its next support at the level of 1.59680.
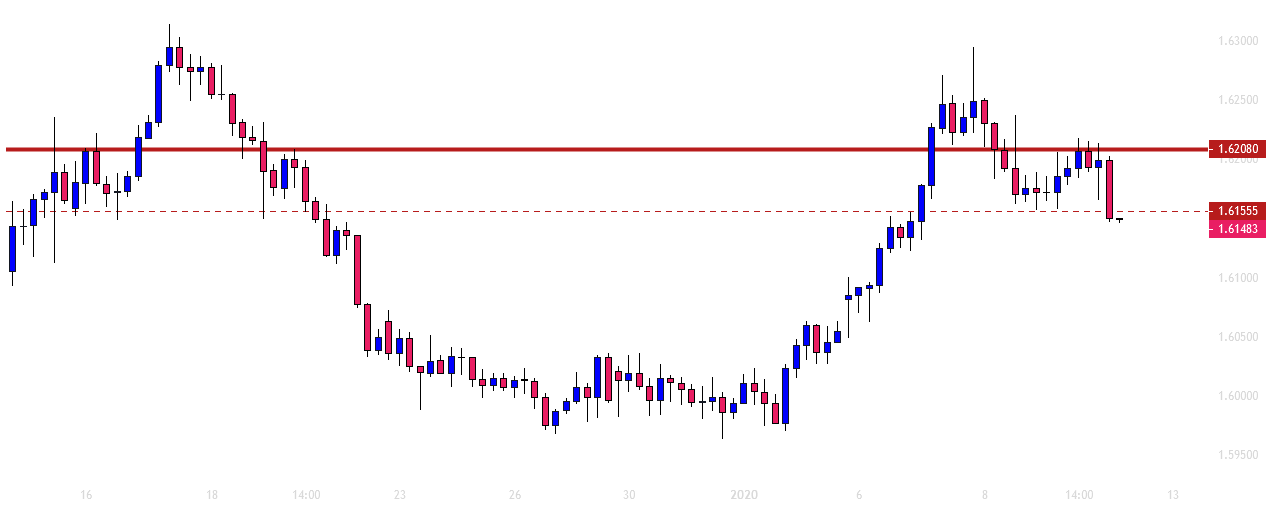
The chart shows that it has produced an ABC pattern. The level of 1.62080 has been point C. The last candle came out as a bearish candle, closing below the level of 1.61555. The sellers may go short on this chart by setting their stop loss above the level of 1.62080. The price may find its next support at the level of 1.60320. This means the price has enough space to travel towards the South, and it offers a lucrative risk-reward to the sellers.
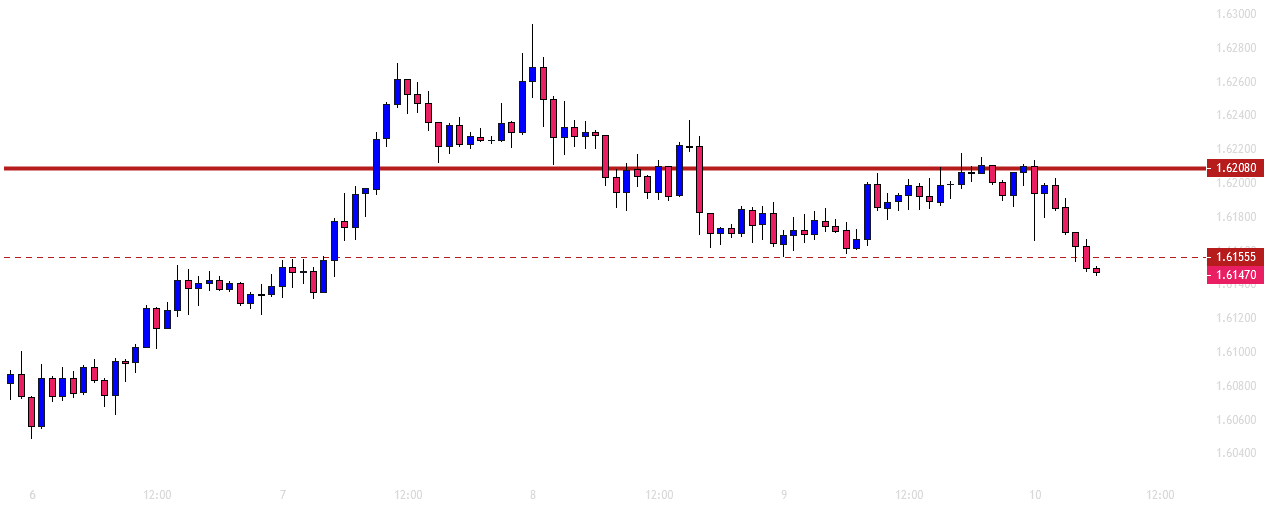
The H1 chart shows that the price makes a breakout at the level of 1.61555. The last candle closed well below the level. If the current candle closes below the breakout candle, the H1 sellers may go short on the pair and drive the price towards the level of 1.60700. On the other hand, if the price goes back within the level again, the pair may get choppy on the H1 chart for the rest of the day. The price may find its resistance at the level of 1.62080, which may not attract the H1 buyers to go long as far as risk-reward is concerned.
All three charts look good for the bears. A strong bearish daily candle to wrap up a week means a lot. It may make the pair bearish on the weekly chart as well. We find that out later. Meanwhile, the daily, the H4, and the H1 sellers may make some green pips by selling the pair.
Author

EagleFX Team
EagleFX
EagleFX Team is an international group of market analysts with skills in fundamental and technical analysis, applying several methods to assess the state and likelihood of price movements on Forex, Commodities, Indices, Metals and


