EUR/AUD: Is it getting ready for more bullish moves?
EUR/AUD made a strong bullish move yesterday. The daily chart shows that the price after having a bounce at a level of support has been heading towards the North. It consolidated for two days and made that significant move yesterday. The way it has been heading towards the North, it may make a breakout at the last swing high.
Let us have a look at the daily EUR/AUD chart.
Chart 1 EUR/AUD Daily Chart
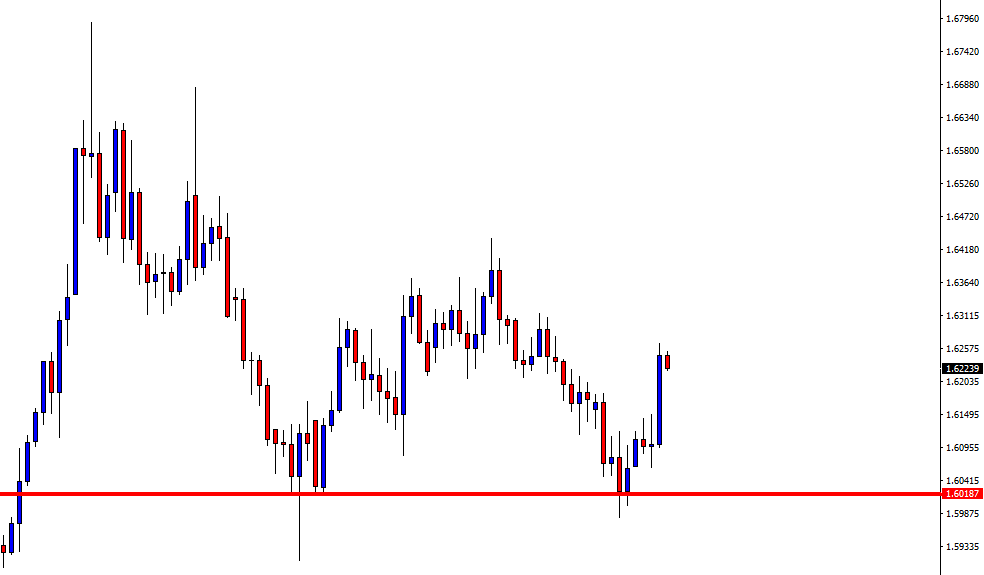
The daily chart shows that the price found its support at the level of 1.60200. It produced an Inside Bar. However, it has kept going towards the North. Yesterday’s daily candle came out as a bullish Marubozu candle, which states that the buyers are in control. Any intraday breakout at yesterday’s highest high may push the price towards the North with good bullish momentum. On the other hand, after such a big move, the price often makes a correction. Thus, the pair may end up producing an Inside Bar today. An Inside bar shall attract the buyers to look for long opportunities next week.
Let us now have a look at how the intraday charts look.
Chart 2 EUR/AUD H4 Chart
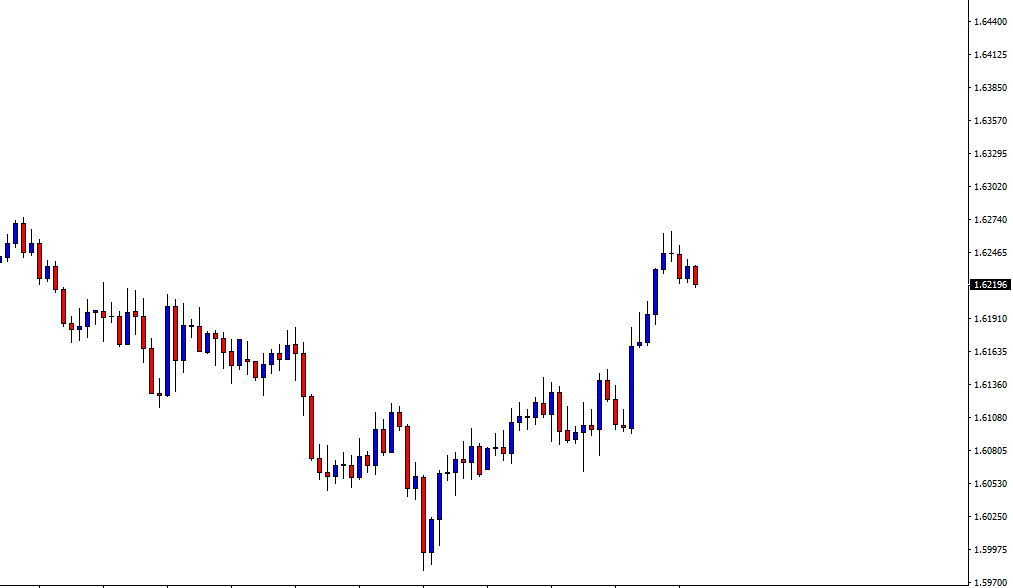
The chart shows that after being very bullish, the price is in consolidation. If the price finds a level of support, upon producing a bullish reversal candle and a breakout at yesterday’s highest high may attract the H4 buyers to go long on the pair. The H4 chart may find resistance at the level of 1.63150. If it keeps having a downward correction, it may come up to 1.61480 to find its support. If it makes such a long correction, the H4 traders may have to wait long to find their next buying opportunity.
Chart 3 EUR/AUD H1 Chart
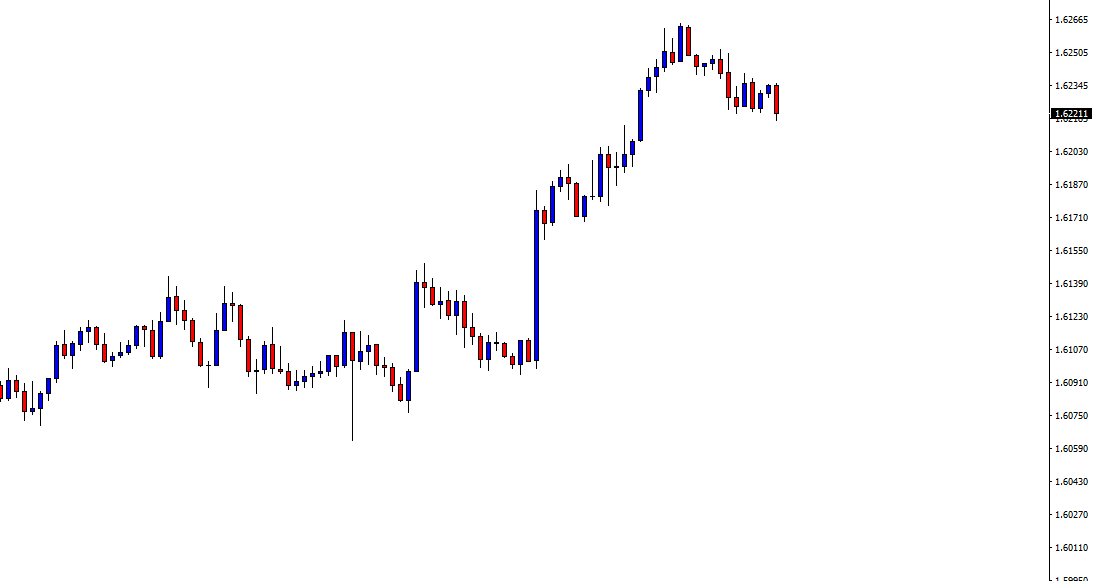
The H1 chart shows that the price has been heading towards the South with enough bearish momentum. The price has been in consolidation. As of writing, the chart is producing an engulfing bearish candle, which may breach consolidation support. A downside breakout after such a long consolidation may attract the sellers to go short up to the level of 1.62000.
The daily chart looks good for the buyers. The H4 chart looks neutral, and the H1 chart looks good for the sellers. These two intraday charts may help the pair have a corrective day today. However, bullishness on the daily chart may make the pair more bullish at the beginning of the week.
Author

EagleFX Team
EagleFX
EagleFX Team is an international group of market analysts with skills in fundamental and technical analysis, applying several methods to assess the state and likelihood of price movements on Forex, Commodities, Indices, Metals and


