EUR/AUD: Bearish correction may be extended

EUR/AUD produced three consecutive bearish candles on the daily chart after being bullish for a long time. However, the daily chart still favors buyers. Any daily bullish reversal candle may push the price towards the North again. On the contrary, major intraday charts such as the H4 and the H1 chart look good for the sellers. Thus, the pair may make a bearish move and remain bearish on the intraday charts.
Chart 1 EUR/AUD H1 Chart
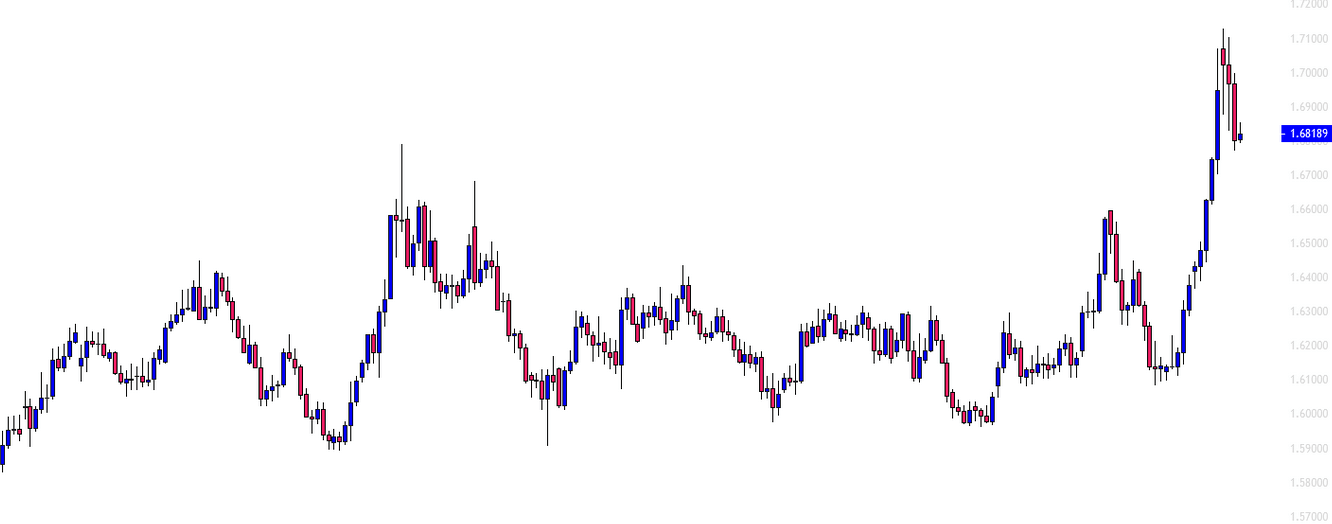
The chart shows that the pair made a long bullish move upon finding its support at the level of 1.61000. It had a rejection at the level of 1.70850 and produced three consecutive bearish candles. The price on the daily chart may head towards the South further to find its support. The level of 1.65535 is a significant level, which may play a vital role in determining its next direction. Since there is enough space for the price to travel, thus the pair may remain bearish for a while on the daily chart. If the price finds its support above the level of 1.65535 and produces a bullish reversal candle, the buyers may go long again and push the price towards the North further.
Chart 2 EUR/AUD H4 Chart
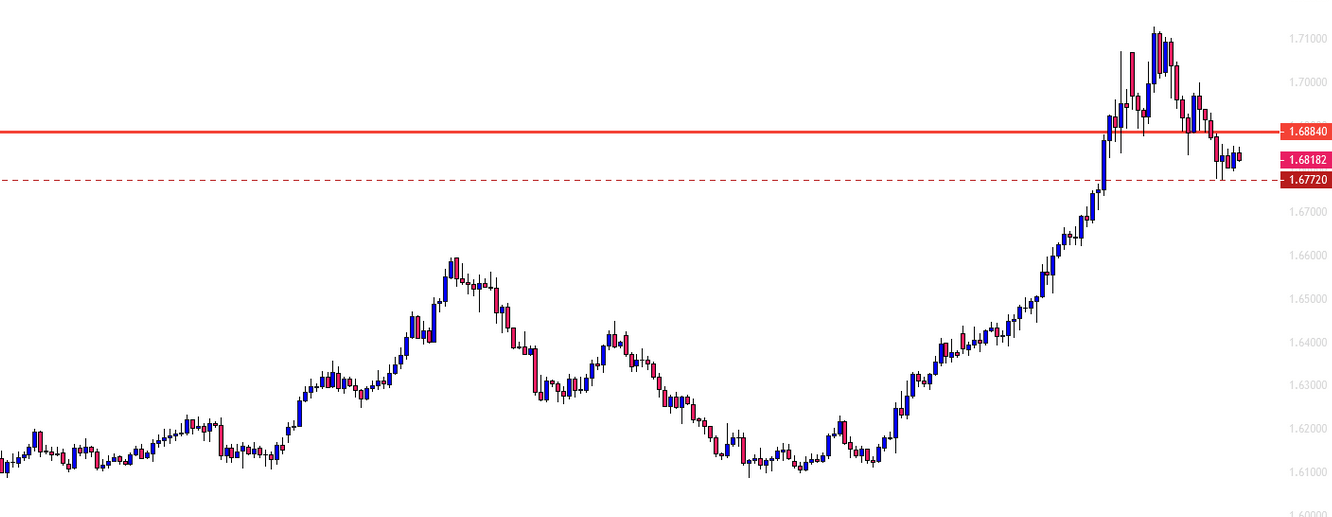
The chart shows that EUR/AUD has been bearish upon producing an ABC pattern. At the last move, it made a breakout at the level of 1.68840. The level of 1.67720 has been working as support. The price may go towards the breakout level again. The sellers may wait for a bearish reversal candle at the level of 1.68840 and go short below 1.67720. The price could find its next support at 1.66645. In case of a bullish breakout, the EUR/AUD may find its next resistance at the level of 1.70850.
Chart 3 EUR/AUD H1 Chart
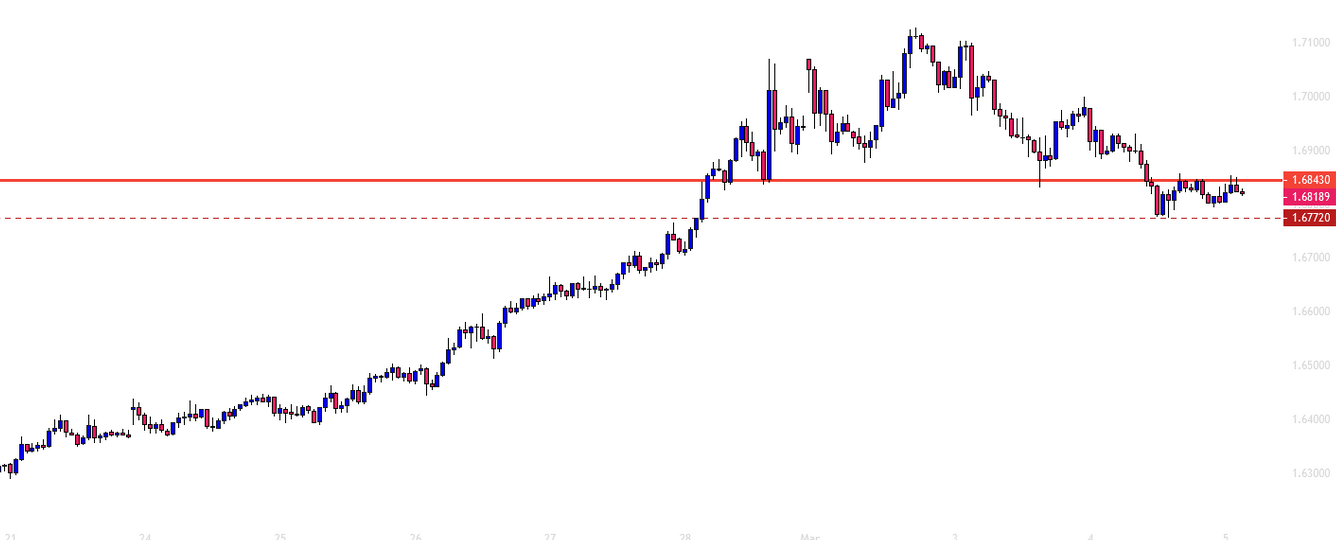
The H1 chart shows that the pair has rejection twice at the level of 1.68430. If the price creates a breakout at the level of 1.67720, it would be a double top neckline breakout. EUR/AUD may head towards the level of 1.66745. In case of a bullish breakout, EUR/AUD price may find its next resistance at the level of 1.69385. This means the bear has more space to travel than the bull.
The daily is neutral, but the H4 and the H1 charts look good for the sellers. Considering these three charts, it seems that the pair may make a bearish move today.
Author

EagleFX Team
EagleFX
EagleFX Team is an international group of market analysts with skills in fundamental and technical analysis, applying several methods to assess the state and likelihood of price movements on Forex, Commodities, Indices, Metals and


