Ethereum is an open-source blockchain-based distributed computing platform featuring smart contract functionality. It provides a decentralized Turing-complete virtual machine, the Ethereum Virtual Machine (EVM), which can execute scripts using an international network of public nodes. Ethereum also provides a crypto-currency token called “ether”, which can be transferred between accounts and used to compensate participant nodes for computations performed.

Ethereum went live in 2015, it quickly gained attraction in the digital world and it’s currently the second largest Crypto-Currency with 20 Billion Dollar in market cap surpassing Ripple (11 Billion) and sitting behind the Bitcoin (39 Billion). Since the start of 2017 , all the digital currencies doubled its value after after prices kept rising higher in the recent months and buyers all over the world jumping in to take a piece of the rally.

Looking at the some daily charts of the digital coins, you’ll probably see a parabolic curve to the upside which may seems hard to catch any trade. However using our swing sequences and following the trend which is clearly bullish as the instrument keeps making higher highs then buying the pullbacks in 3 , 7 or 11 swing was the right way to catch every dip during the recent rally.
Let’s take a look at the lower time frame chart of Ethereum and Bitcoin and explore the potential scenarios.

Ethereum: ETHUSD 4H Chart 05/31/2017

ETHUSD

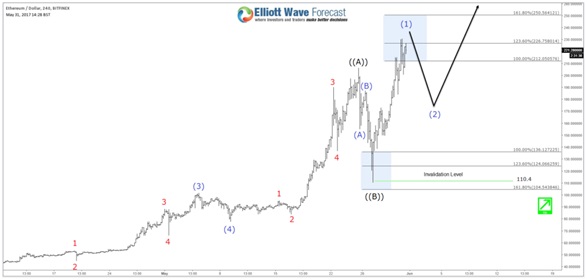
Ethereum saw a 50% decline from 05/25/2017 peak which may caused a lot of fear around the market, but looking at the technical picture the correction came after a 5 waves move from the lows and that why it was another great opportunity to buy ETHUSD after 3 waves zigzag pullback into the equal legs area 136 – 104. The instrument already rallied from the inflection area and managed to make a new all time highs opening a new extension to the upside toward ideally 315 – 365 area. In the shorter term, a pullback from 225 – 250 can be seen against 110 low but it can be just a shallow 3 waves pullback before Ethereum resumes the rally again as it has an incomplete bullish sequence.

BITCOIN: BTCUSD 1H Chart 05/31/2017

BTCUSD

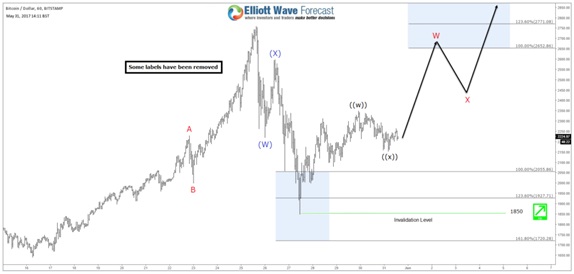
The same thing happened for Bitcoin which saw a 65% correction from 05/25 peak which unfolded as a double three structure and managed to finish the 7th swing around the equal legs area 2055 – 1720. The reaction from that area wasn’t strong enough to break to new high like the case of Ethereum but BTCUSD created a short term incomplete bullish sequence from 05/27 low which could take it toward equal legs area 2652 – 2771 before another pullback is seen. Bitcoin still needs to break the previous peak to open a new extension highs that can take it another $1000 higher. However if it fails to make new highs then there is still the possibility for a double correction which will represent another opportunity to buy it again.

Recap

Ethereum is the one leading the move for the rest of crypto-currencies as ETHUSD already made new all time highs and opened the door for another leg to the upside, which means Bitcoin should ideally follow the same path even it’s currently still lagging the equivalent move.

Buying crypto-currencies is the hot theme for 2017, investors has already added different types of digital coins to their portfolio and traders are trying to catch the long side of the rally. However there is huge volatility with these kind of instrument which causes sharp declines in few hours that can trick short term traders and may cause a lot of problem. That’s why unless you are owning these crypto-currencies from lower levels and looking to hold it for a long time then it’s better to pay attention to the market structure and learn how identify the right sequence and cycle to allow you to buy it the right area to protect you trade after the first reaction.


Become a Successful Trader and Master Elliott Wave like a Pro. Start your Free 14 Day Trial at - Elliott Wave Forecast.

FURTHER DISCLOSURES AND DISCLAIMER CONCERNING RISK, RESPONSIBILITY AND LIABILITY Trading in the Foreign Exchange market is a challenging opportunity where above average returns are available for educated and experienced investors who are willing to take above average risk. However, before deciding to participate in Foreign Exchange (FX) trading, you should carefully consider your investment objectives, level of xperience and risk appetite. Do not invest or trade capital you cannot afford to lose. EME PROCESSING AND CONSULTING, LLC, THEIR REPRESENTATIVES, AND ANYONE WORKING FOR OR WITHIN WWW.ELLIOTTWAVE- FORECAST.COM is not responsible for any loss from any form of distributed advice, signal, analysis, or content. Again, we fully DISCLOSE to the Subscriber base that the Service as a whole, the individual Parties, Representatives, or owners shall not be liable to any and all Subscribers for any losses or damages as a result of any action taken by the Subscriber from any trade idea or signal posted on the website(s) distributed through any form of social-media, email, the website, and/or any other electronic, written, verbal, or future form of communication . All analysis, trading signals, trading recommendations, all charts, communicated interpretations of the wave counts, and all content from any media form produced by www.Elliottwave-forecast.com and/or the Representatives are solely the opinions and best efforts of the respective author(s). In general Forex instruments are highly leveraged, and traders can lose some or all of their initial margin funds. All content provided by www.Elliottwave-forecast.com is expressed in good faith and is intended to help Subscribers succeed in the marketplace, but it is never guaranteed. There is no “holy grail” to trading or forecasting the market and we are wrong sometimes like everyone else. Please understand and accept the risk involved when making any trading and/or investment decision. UNDERSTAND that all the content we provide is protected through copyright of EME PROCESSING AND CONSULTING, LLC. It is illegal to disseminate in any form of communication any part or all of our proprietary information without specific authorization. UNDERSTAND that you also agree to not allow persons that are not PAID SUBSCRIBERS to view any of the content not released publicly. IF YOU ARE FOUND TO BE IN VIOLATION OF THESE RESTRICTIONS you or your firm (as the Subscriber) will be charged fully with no discount for one year subscription to our Premium Plus Plan at $1,799.88 for EACH person or firm who received any of our content illegally through the respected intermediary’s (Subscriber in violation of terms) channel(s) of communication.

Recommended Content


Recommended Content

Editors’ Picks

AUD/USD posts gain, yet dive below 0.6500 amid Aussie CPI, ahead of US GDP

AUD/USD posts gain, yet dive below 0.6500 amid Aussie CPI, ahead of US GDP

The Aussie Dollar finished Wednesday’s session with decent gains of 0.15% against the US Dollar, yet it retreated from weekly highs of 0.6529, which it hit after a hotter-than-expected inflation report. As the Asian session begins, the AUD/USD trades around 0.6495.

AUD/USD News

USD/JPY finds its highest bids since 1990, approaches 156.00

USD/JPY finds its highest bids since 1990, approaches 156.00

USD/JPY broke into its highest chart territory since June of 1990 on Wednesday, peaking near 155.40 for the first time in 34 years as the Japanese Yen continues to tumble across the broad FX market. 

USD/JPY News

Gold stays firm amid higher US yields as traders await US GDP data

Gold stays firm amid higher US yields as traders await US GDP data

Gold recovers from recent losses, buoyed by market interest despite a stronger US Dollar and higher US Treasury yields. De-escalation of Middle East tensions contributed to increased market stability, denting the appetite for Gold buying.

Gold News

Ethereum suffers slight pullback, Hong Kong spot ETH ETFs to begin trading on April 30

Ethereum suffers slight pullback, Hong Kong spot ETH ETFs to begin trading on April 30

Ethereum suffered a brief decline on Wednesday afternoon despite increased accumulation from whales. This follows Ethereum restaking protocol Renzo restaked ETH crashing from its 1:1 peg with ETH and increased activities surrounding spot Ethereum ETFs.

Read more

Dow Jones Industrial Average hesitates on Wednesday as markets wait for key US data

Dow Jones Industrial Average hesitates on Wednesday as markets wait for key US data

The DJIA stumbled on Wednesday, falling from recent highs near 38,550.00 as investors ease off of Tuesday’s risk appetite. The index recovered as US data continues to vex financial markets that remain overwhelmingly focused on rate cuts from the US Fed.

Read more

Majors

Cryptocurrencies

Signatures