Equity markets look to rebound, but will it last?

Market Overview
After Wall Street sold sharply lower once more yesterday, there are signs of stabilisation this morning. The big question is how traders respond to a technical rally. It will also help to show whether the market has sustainably shifted outlook. If a technical rally is sold into and used as another chance for the bears to renew sort positioning, then equity investors could be in for a rough ride in the coming weeks. However a solid rebound that starts to build higher lows again could be seen as s steadying hand on the tiller. It is interesting to see Asian markets finding support late into their session. The move seems to have been supported by a dramatic positive surprise in the Chinese Trade Balance, driven by a sharp improvement in exports. The balance was +$31.7bn well above the expected +$19.4bn (+$27.9bn in August), with imports +14.3% (+15.0% exp, +19.9% last) and exports an impressive +14.5% (+8.9% exp, +9.8% last). It is also interesting to see that bond yields are picking up again. There seems to have been some confusion with how Treasury yields have moved recently and the impact. Initially with the equities selling pressure we saw yields rising (bond selling off) as equities have, this reflected serious fear on markets with traders selling everything. However, in yesterday’s session there was a sharp move lower on Treasury yields as investors dipped back into the safe haven of US bonds again, with the usual bonds/equities relationship resuming. This hit the dollar. With yields ticking back higher again today, this is coming as market sentiment is picking up again. So, if bond markets can stabilise this should help broader market risk appetite to also stabilise. However, bond markets need to be watched closely as if this rebound in yields turns out to be another push strongly higher, then we are likely to see renewed selling pressure across risk assets once more.
Wall Street closed sharply lower again, with the Dow over 500 ticks lower (-2.1%) and the S&P 500 -2.1% at 2728. However, futures are showing a retracement higher today, well over a percent higher currently. This rebound on futures has helped Asian markets higher into the close with the Nikkei +0.5% and China’s Shanghai Composite +1.0%. In Europe the moves are also looking higher. In forex markets there is a dollar rebound showing through primarily with yen underperformance, whilst other majors are showing little real move. In commodities, gold is now unwinding some of yesterday’s huge gains, currently dropping back by $7, whilst silver is also slightly lower, whilst oil has rebounded 1% after yesterday’s latest loss.
It is a relatively quiet end to the week with little on the calendar for the European morning aside from Eurozone Industrial Production at 1000BST which is expected to deteriorate to -0.2% for the year. The University of Michigan Sentiment is at 1500BST and is expected to show a mild improvement to 100.4 (from the downwardly revised 100.1 last month). There is also a Fed speaker to look out for with Raphael Bostic (voter, mild dove) at 1730BST.
Chart of the Day – EUR/CHF
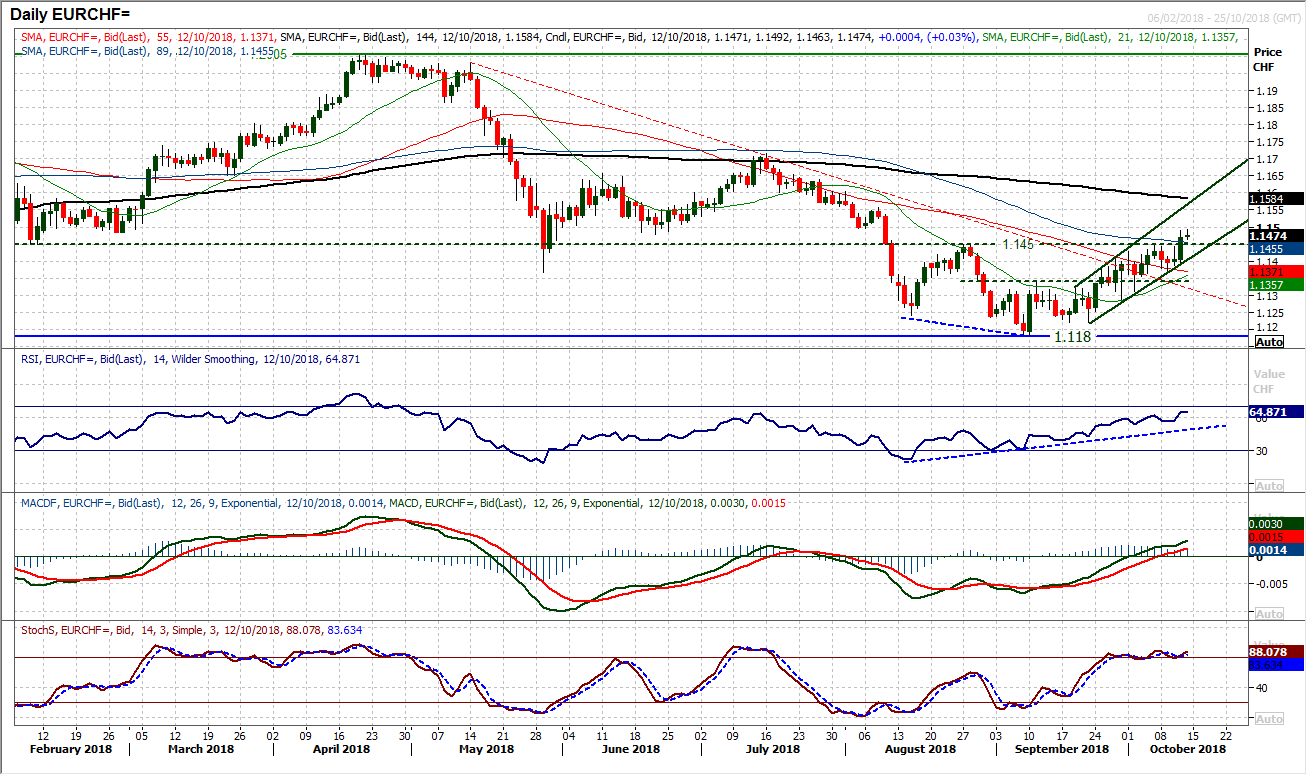
During this time of elevated volatility in equities which is extending into other asset classes, there is a forex cross that retains a relative degree of stability and recent trends appear unaffected. This is Euro/Swiss which has been building a recovery over recent weeks and continues to show signs of a key breakout. In the past four weeks, there has been an uptrend channel formation as the market has found support above a near term breakout at 1.1345. In this time, the momentum indicators have been progressing higher as that market has tested the resistance overhead at 1.1450. The move higher has been rather serene with a run of higher lows, but yesterday’s decisive bull candle has closed above 1.1450 to complete a move to a two month high. With momentum increasingly strong there is confirmation, with the RSI above 60 and Stochastics strongly configured. Yesterday solid bull candle now sets the bulls up for buying into intraday weakness, with 1.1450 now an initial basis of support.. This close above 1.1450 also completes a base pattern that implies around 200 pips higher. This week’s reaction low at 1.1365 is growing as support and is now another higher low.
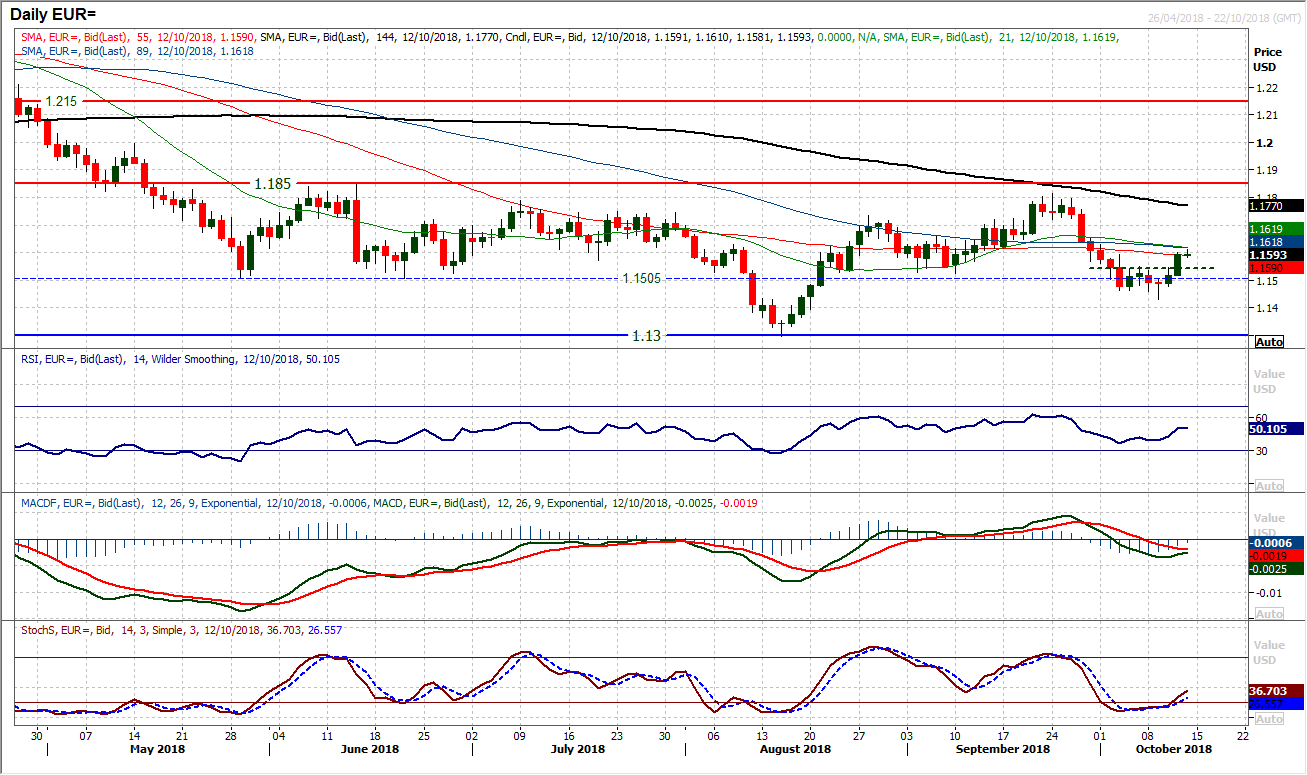
The recovery on EUR/USD continues to build as a decisive and solid bull candle formed yesterday to confirm a mini base pattern through $1.1550. The implications of this (seen best on the hourly chart) are that there will be a recovery towards $1.1650 again. Being accompanied by improving momentum indicators helps to confirm the rebound too. If the MACD lines can post a bull cross to join the Stochastics and RSI pulling higher then the outlook for recovery will really take shape. The hourly chart shows the neckline breakout at $1.1550 whilst a run of higher lows and increasingly positive hourly momentum configuration is taking hold. The old near term pivot at $1.1650 is the key test now. If the market can break above the resistance of the pivot then this will certainly be a key development. How the market responds to a setback will also be crucial. Another higher low formed above $1.1500/$1.1550 support band will be highly encouraging.
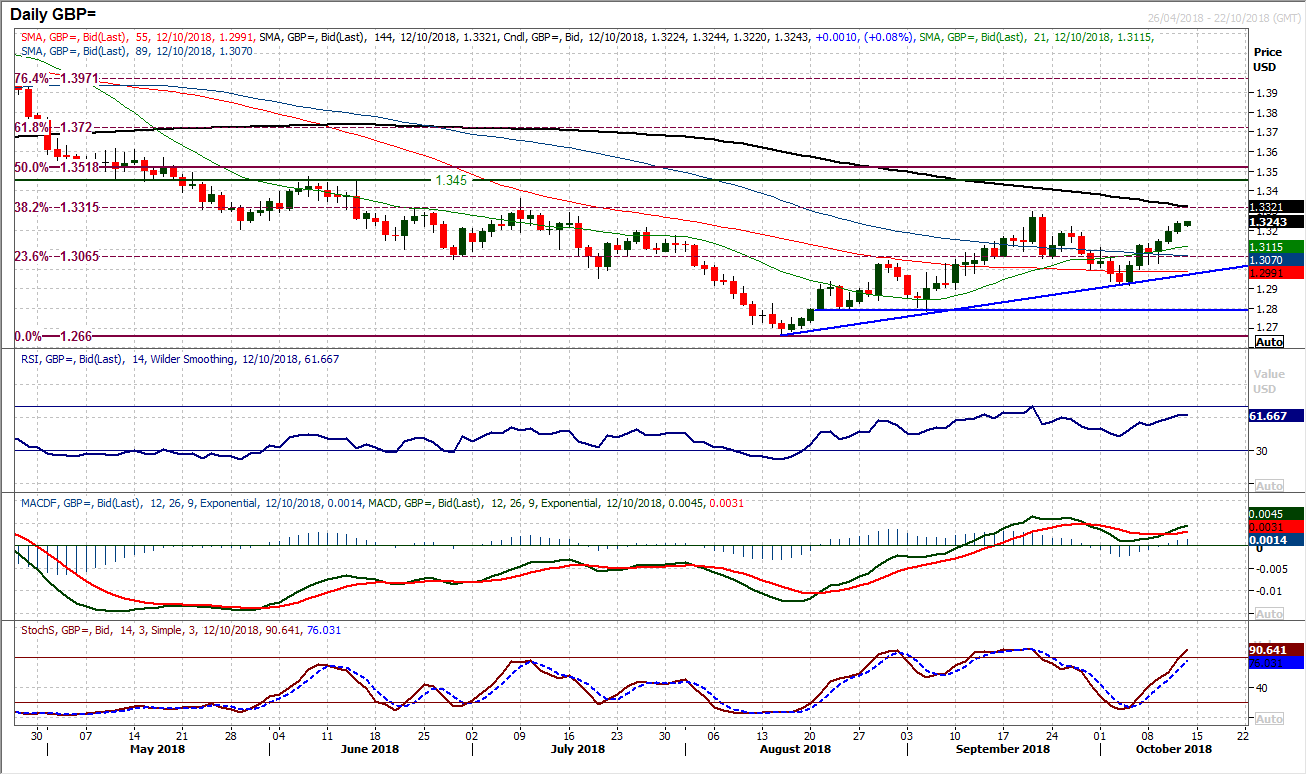
Cable continues to form solid positive candles that are pulling the market towards a test of the key near term resistance at $1.3297. A close above the reaction high of $1.3215 is the latest step towards this. Momentum indicators are progressing well now for this move too. The bulls will be looking to continue buying into intraday weakness and the hourly chart shows positive configuration on momentum now, with the support of a near term uptrend channel meaning that another higher low above $1.3130/$1.3135 would be a strong signal. There is initial support from yesterday’s lows around $1.3180. Beyond $1.3297 which is the key September high, the resistance is at $1.3360.
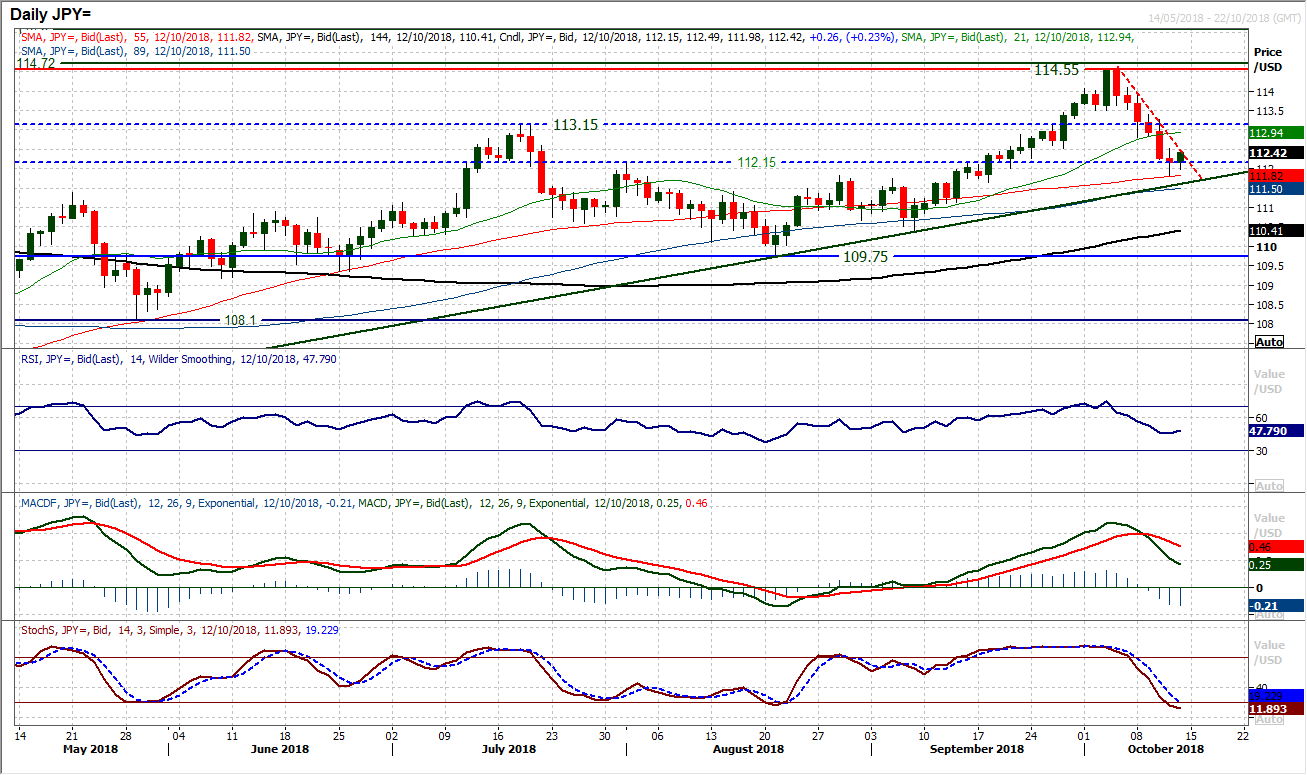
If the yen performance is considered to be an indication of broader market sentiment, then a rally on Dollar/Yen would be considered an encouraging sign. With this is mind, the selling pressure through Dollar/Yen showed some initial signs of dissipating yesterday as the run of decisive bear candles took a pause for breath. However, there is much still to be done to suggest this corrective move is at an end. The move lower of the past week has formed a downtrend which comes in at 112.50 today and is an initial gauge of resistance. Today’s early rebound is now testing this mini-downtrend and is looking to leave support at 111.85. It is interesting to also see momentum indicators still negatively configured with the MACD and Stochastics still accelerating lower, however the RSI is beginning to look relatively stable now. It will be important to see how the bulls respond now, as the hourly chart retains a negative configuration with the hourly RSI failing under 60 and MACD lines struggling under neutral. However, there are also mid positive divergences with yesterday’s low which again adds potential for this to be an exhaustion move. Above 112.50 improves the position today but needs to pull through 112.80 to take a trend breach and improve the chart in a meaningful way. Another failure under initial resistance at 112.80 would suggest continued correction.
Gold
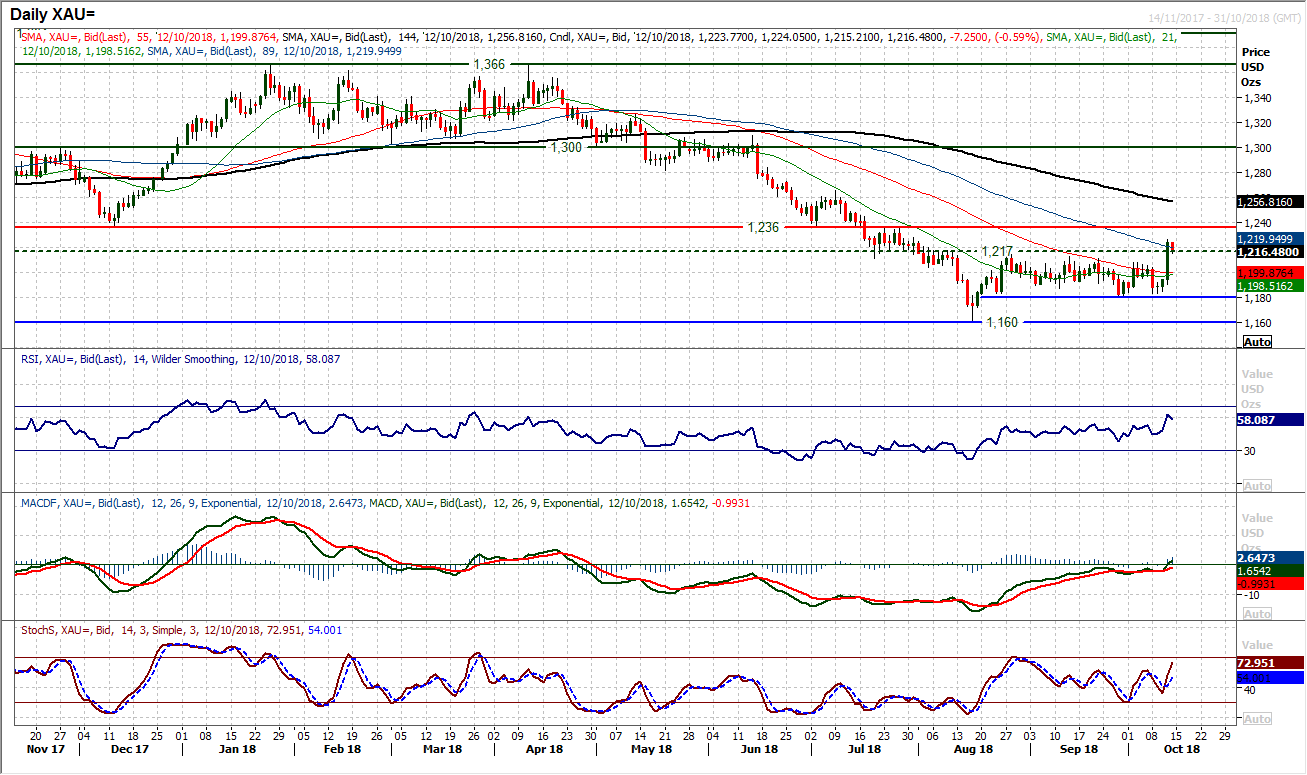
Finally there has been some traction in trading gold. After weeks of rallies fading at lower levels a big bull candle formed yesterday in the wake of a negative surprise in US inflation. Breaking through a range of overhead resistance between $1208/$1214 during yesterday’s session, gold completed a decisive bull candle which added well over 2% to the price. This sudden move has come after weeks of stagnant price moves and constant retracements. The question is whether the most bullish one day candle since 24th August (when the market rallies +2.5% and $29) can generate the momentum for a decisive move higher. Yesterday was the biggest positive day on gold since June 2016. The RSI above 60 is a six month high and the MACD lines are now threatening upside traction. The breakout means that the old highs between $1208/$1214 should now be seen as underlying demand and supportive. The market is unwinding a shade this morning but how the bulls respond to this unwind will be key. If it is used as another chance to buy with support formation, then there is real potential for a recovery being sustainable. Above yesterday’s high of $1226 the next resistance is at $1236.
WTI Oil
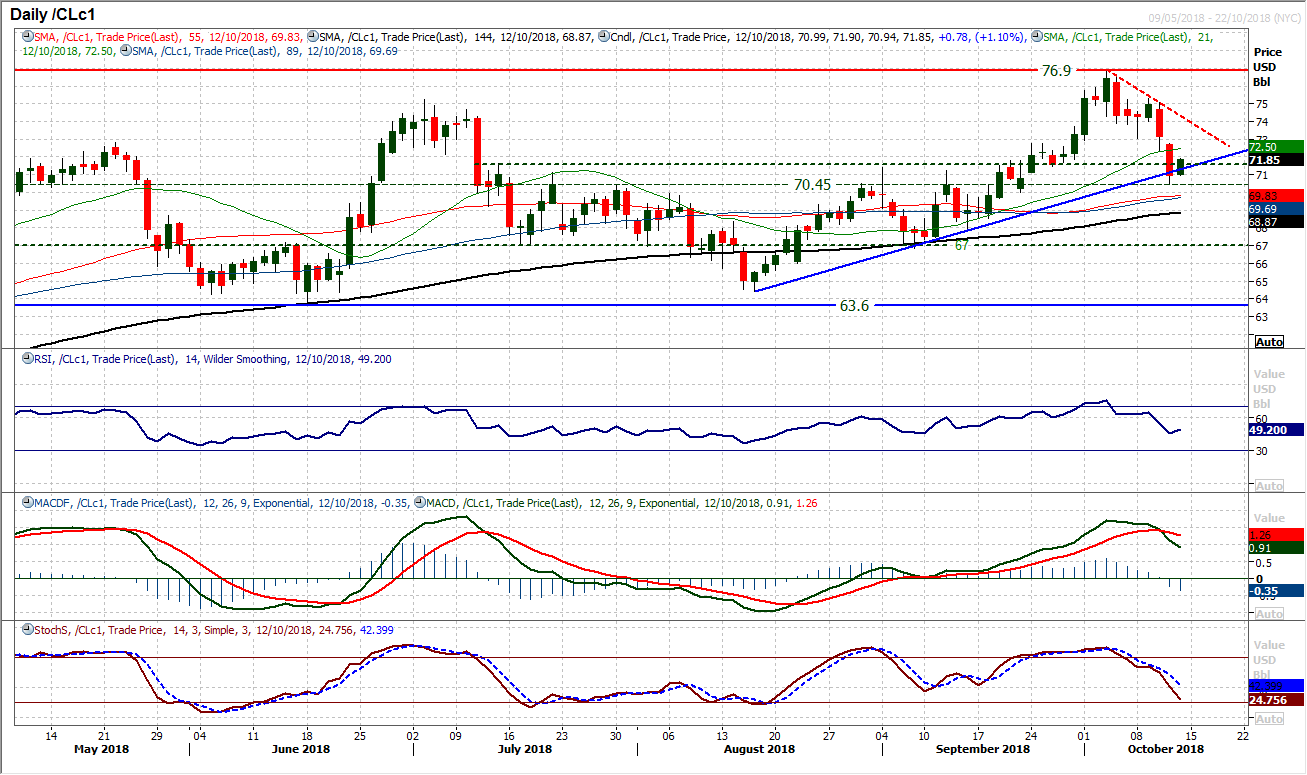
A much larger EIA inventory build than had been expected helped to add momentum to an already corrective oil price yesterday. On WTI the pullback to the 8 week uptrend has been sharp and the concern is with magnitude of the bearish candles in recent sessions. The near term importance of this trend support (today at $71.30) is elevated as the market has pulled below the $71.65 breakout. In intraday break of the trend yesterday has not been confirmed, and there has been an initial rebound today. If this rebound fails then there could be an acceleration of the move lower. Momentum indicators are increasingly corrective now with the RSI below 50, Stochastics accelerating lower and more importantly a bear cross on the MACD lines. This is the first bear cross on MACD since July, the last of which came as a harbinger of a subsequent correction of around 10%. The hourly chart shows negative momentum configuration now with overhead supply in the band $71.85/$72.50, with further overhead supply around $73.00.
Dow Jones Industrial Average
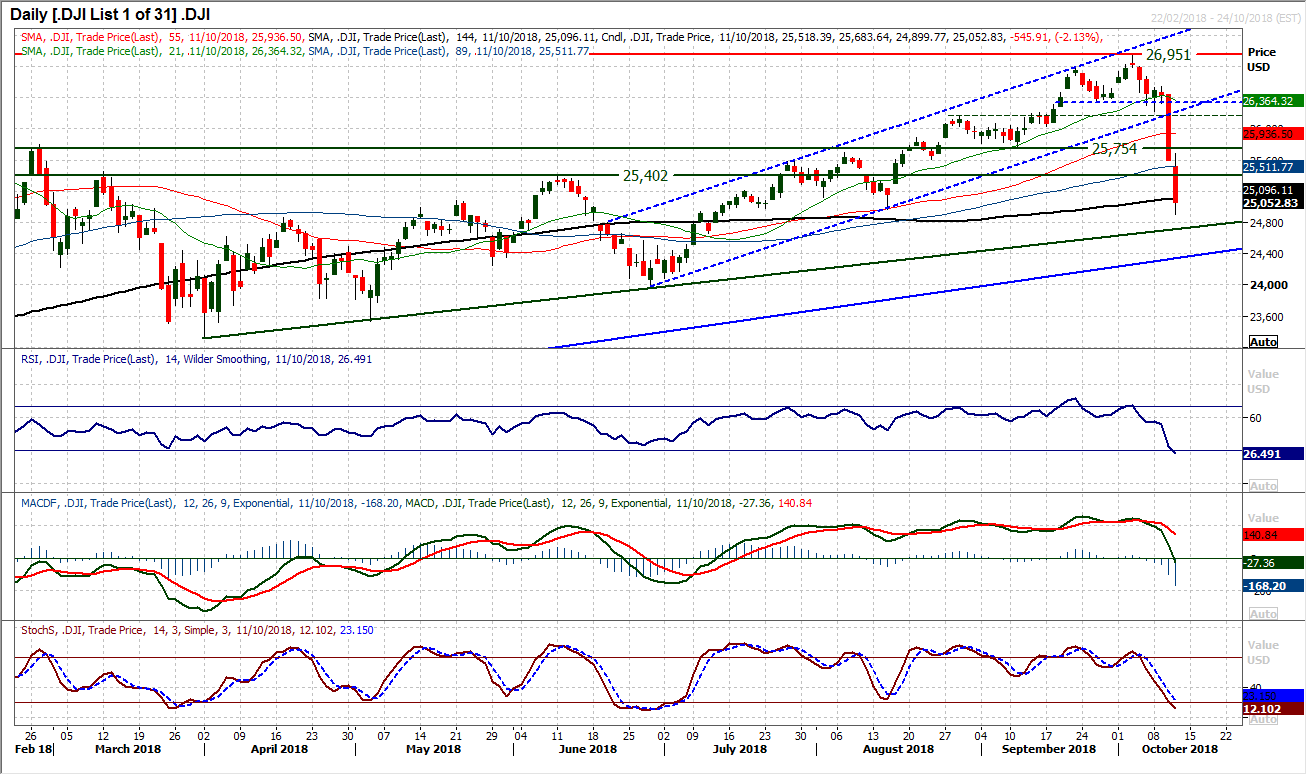
The selling pressure has been significant through Wall Street. A second huge bear candle has pulled the Dow to three month lows. With volatility spiking higher, equity traders are in for a rough ride. Wall Street futures are already showing a rebound of over 1% today (c. 300 ticks currently), so the choppy ride shows little sign of dissipating. Can a rebound begin to take shape? The concern is that yesterday’s downside gap was bearishly filled intraday and this means that resistance is mounting between 25,600/25,750. Ow the market responds to this rebound will also be key. An intraday rally that fails and turns lower again could open the flood-gates once more. Yesterday’s low at 24,900 is now going to be a key gauge of support. A breach would open the key June low around 24,000. Once the dust settles, then a more considered technical outlook can be ascertained, but during the wild times, it tends to be a momentum trade, so being mindful of stops and positioning tends to be a wise move.
Author

Richard Perry
Independent Analyst


