Equity market chart book

While the path of least resistance for the market may still be lower for now, in my assessment the drawdown that started at the beginning of the year is probably well over halfway done.
Market corrections typically have violent “V” shaped bottoms that are impossible to time. To accurately call the bottom on the day would inevitably be a deeply contrarian view. How many people thought March 23rd, 2020 would be the market low? The market rallied 9.4% the next day and never looked back, going on to make new all-time highs. The market rallied 6.4% the day after March 2009 low and 5.0% the day after the December 2018 low. And any new sustained advance that goes on to make new all-time highs will look indistinguishable from a so-called “bear market rally” for some time. As the adage goes, markets don’t bottom on good news. They tend to bottom on poor liquidity and dire sentiment, before any clear improvement in the fears of the day (e.g., inflation, Fed, war, lockdowns).
Though it’s no guarantee of the outcome, I continue to view the most recent all-time high (on Jan 3rd) as historically inconsistent with past major market tops and therefore unlikely to produce a major bear market like that of the early 2000s or 2007-2009 (on the S&P 500).
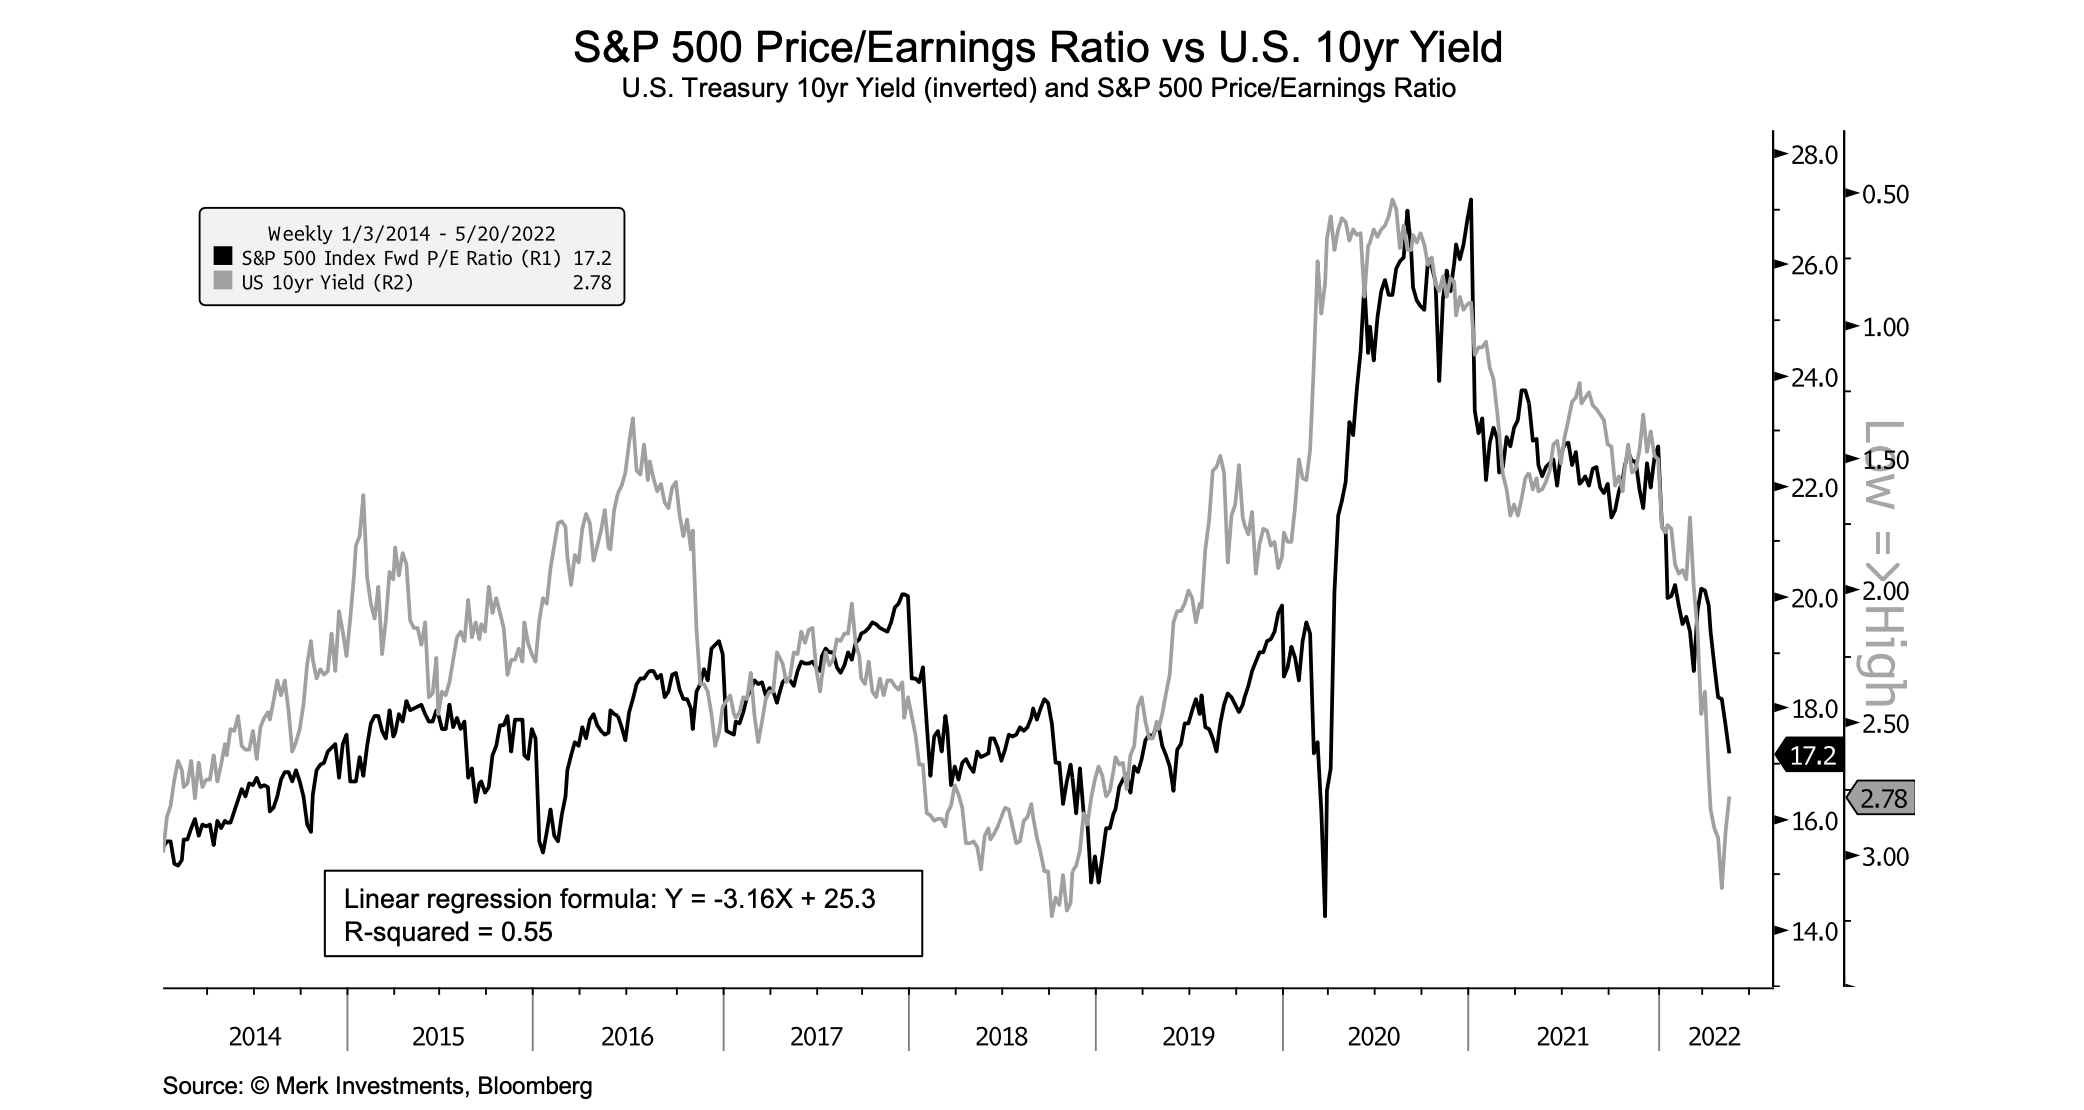
The US 10yr yield is at or above most fair value estimates, which currently range from 2.4% to 2.9%. And the 10-year real rate (net of inflation expectations) is positive, at around +0.25%, which is within the range of most estimates of the neutral real rate (r*). Therefore, the needed multiple contraction is probably mostly done. Developments in the market over the coming months may be more focused on the earnings outlook. In other words, the market may be driven more by the denominator than the ratio in terms of the price-to-earnings equation.
In my view, the market got ahead of itself through the second half of 2021 and was overdue for a correction. A healthy 10-15% correction probably should have started in the middle of 2021 from around 4300, which would have put the market at around 3700-3800. The market may end up bottoming around there but with a bigger drawdown (20-25%) because of the overshoot late last year.
It seems likely that the S&P 500 drawdown will exceed 20% peak to trough. If so, it might technically be referred to as a ”bear market.” But the 20% decline threshold for defining a bear market is a somewhat arbitrary cutoff point. For example, the Q4 2018 correction was 19.8%. If it had been 20.1% would it be thought of as a bear market?
Behavioral economics suggests that people have an inherent bias towards action–doing something often feels better than doing nothing, and provides the illusion of control. But in reality, doing nothing is often better than doing something. And long-term investors should avoid trying to become short-term traders. As always, everyone needs to put probability and reward-to-risk assessments in the context of their strategy, process, and time horizon.
Author

Axel Merk
Merk Hard Currency Fund
Axel Merk is the Founder and President of Merk Investments. Merk is an expert on macro trends, hard money, international investing and on building sustainable wealth.


