Equity market chart book

For the first time in over a decade, investment-grade bond yields are close to competing with equity market earnings yields (4.2% vs. 4.5%). And US 10yr yields are now roughly double the S&P 500 dividend yield-reducing some of the TINA effect that has underpinned the secular bull market since 2009.
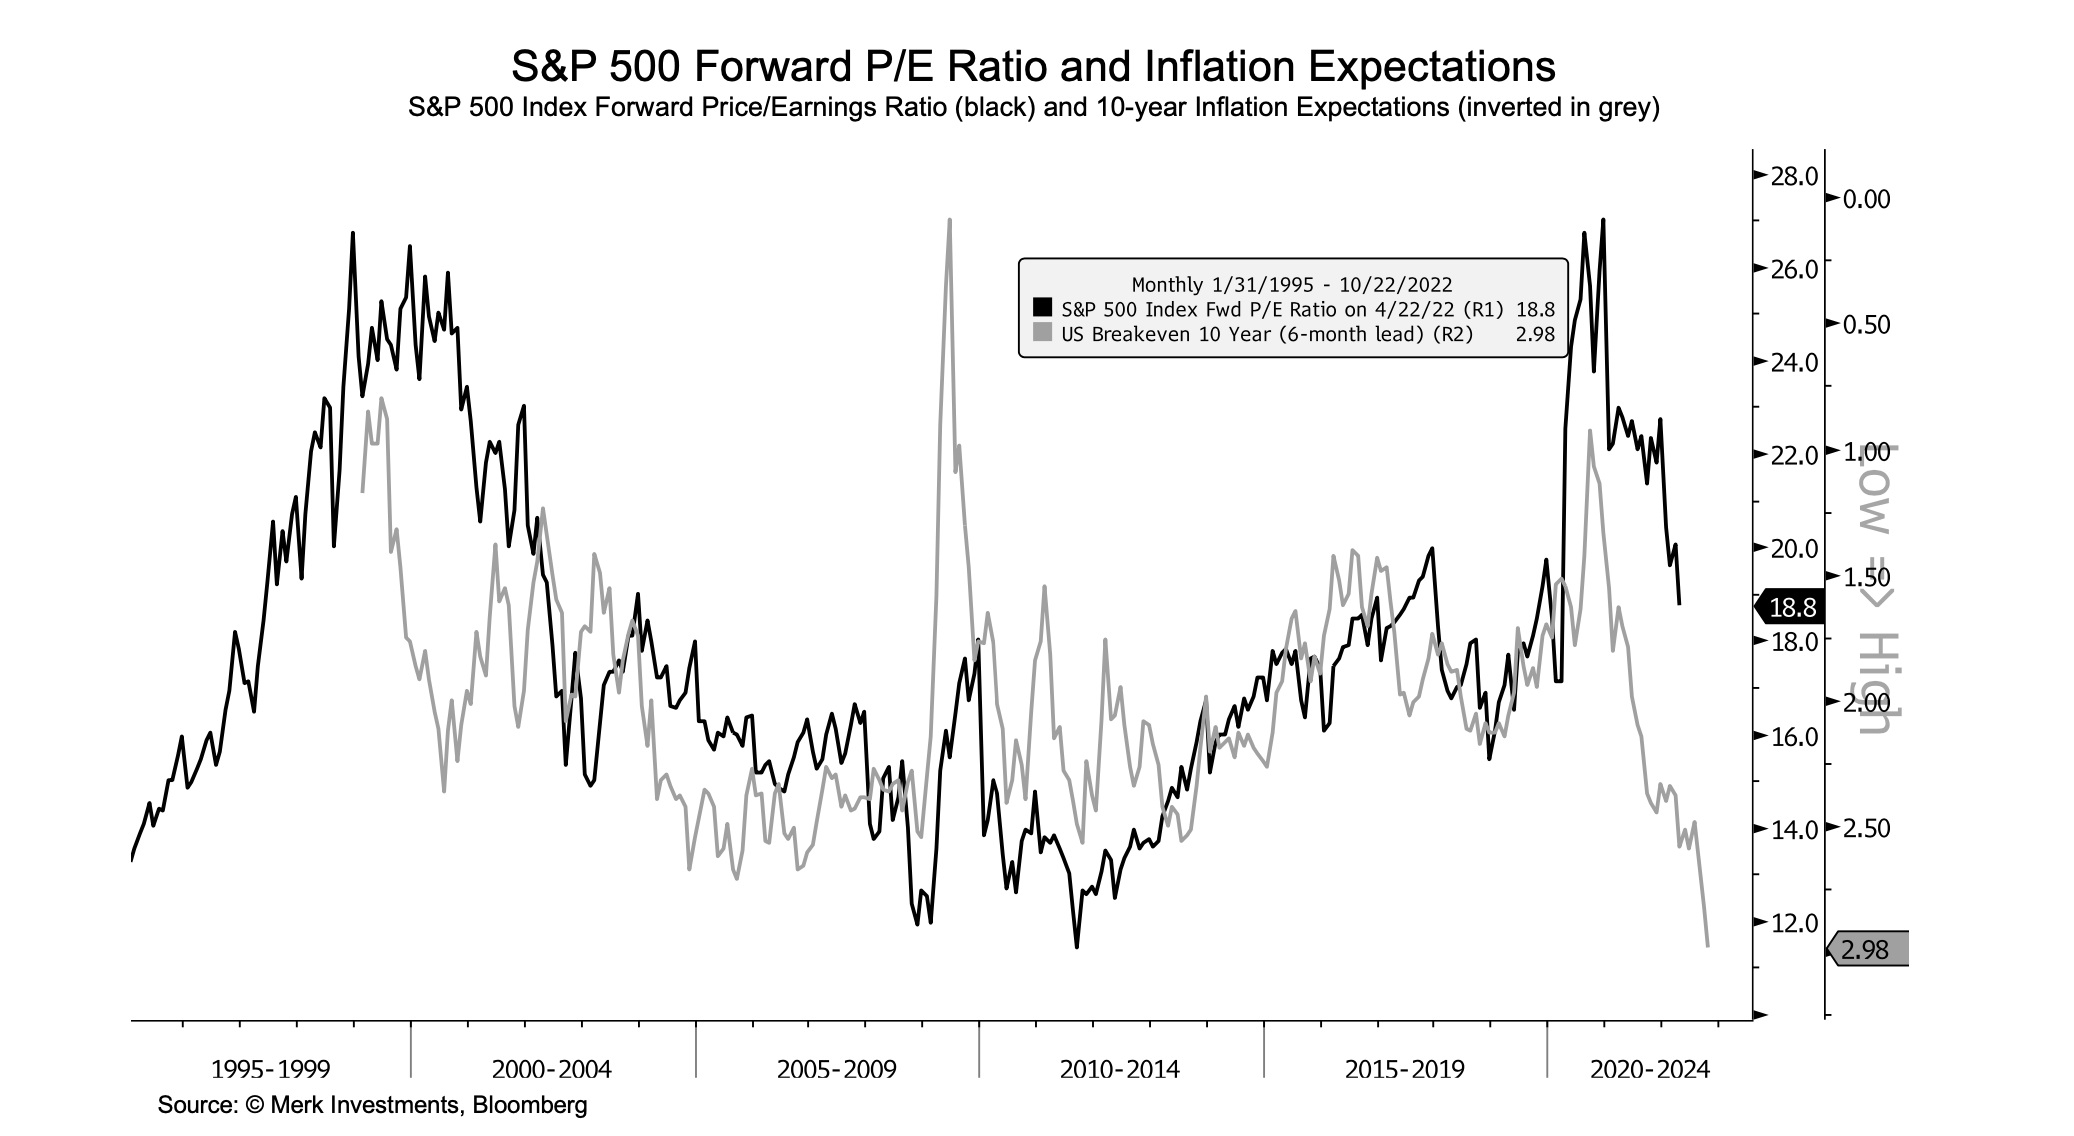
Looking at the relationship between US 10yr yields and valuation multiples over the past several years, a US 10yr yield of 2.9% corresponds to a forward P/E multiple of 16.1x (based on a linear regression analysis, R-squared = 0.55), which is 15% lower than the current multiple of 18.8x. Rising yields (and rising inflation expectations) generally warrant a decline in the P/E multiple (i.e., increase in the earnings yield).
The yield curve (10yr-2yr) has steepened and un-inverted over the past month, but with yields still rising. That's an important distinction. Steepening with yields falling would be the more imminent concerning development - as that's usually a shorter-term leading indicator for an economic recession.
Fiscal drag (i.e., smaller budget deficits) may start to weigh on corporate earnings, household balance sheets, and the domestic private sector generally. The US private sector balance (surplus or deficit) is the inverse of the US government budget deficit net of the trade deficit. In other words, US govt deficits flow to US households and businesses, and to the rest of the world via the trade deficit. The private sector surplus is forecast to be +1.6% for 2022 and +0.8% for 2023. Developments bear watching as the domestic private sector balance went into deficit before the last two major bear markets (starting in 2000 and 2007). The same was true ahead of the 1929 crash and the 1989 Japan crash (looking at Japanese sectoral balances).
As I wrote last month, the current drawdown might exceed 20% peak to trough on the S&P 500, but I don't expect a deep and prolonged bear market like that of the early 2000s or Global Financial Crisis. The last all-time high in the S&P (on Jan 3rd) was inconsistent with past major market tops across several frameworks. Nevertheless, I wouldn't be surprised if the market chops sideways with downside volatility for a while longer, perhaps through a mild recession that occurs sometime over the next two years.
The 1957-58 and 1990-91 recessions might be apt analogs, both relatively mild with modest market drawdowns. Both about 9-month recessions with ~20% max drawdowns. I wouldn't assume the next recession will be as deep as the last two, we're probably overdue for a more garden-variety downturn. Also, the 1957 and 1990 recession/market analogs track roughly with where we are off the 2009 generational low relative to the 1942 and 1974 generational lows.
As always - and particularly right now - the outlook requires constant reassessment. And everyone needs to put probability and reward-to-risk assessments in the context of their strategy, process, and time horizon.
Author

Axel Merk
Merk Hard Currency Fund
Axel Merk is the Founder and President of Merk Investments. Merk is an expert on macro trends, hard money, international investing and on building sustainable wealth.


