Equities report: US employment data in sight

US equities moved higher since our last report. In today’s report we are to have a look at the upcoming US employment data release, ExxonMobil’s earnings which are due out today and a small note in regards to CES 2026. We are to conclude the report with a technical analysis of S&P 500’s daily chart.
US employment data due out Friday
The US Employment data for December is set to be released on Friday. We are of course referring to NFP Friday which is set to garner significant attention from market participants, as it is the first key financial release for the year in regards to the US Equities markets. Looking at what economists have pencilled in, the NFP figure is expected to come in at 55k, lower than the prior release of 64k whilst the Unemployment rate is expected to drop from 4.6% to 4.55 and the average hourly earning r ate is expected to increase from 3.5% to 3.6%. The numbers tend to paint a mixed labour market, where the NFP decreasing may imply a loosening labour market, whilst the reduction in the unemployment rate tends to contradict that argument. Therefore, we would focus on the unemployment rate as the NFP figure is already relatively low, the unemployment rate may paint a more macro picture and could be the predominant driver behind the greenback on Friday. Overall, should the data point towards a loosening labour market, it may increase calls for the Fed to cut rates in their next meeting which may aid the US Equities markets as the financial conditions surrounding the US economy ease. Whereas, should the data point towards a resilient labour market the opposite scenario may occur. In our view, the unemployment rate is the one to watch for, unless the NFP figure posts a negative number or a large surprise to the upside.
Earnings season returns
As our paragraph title suggests, earnings season has returned. In particular, we are noting the release of ExxonMobil’s (#XOM) earnings today, whilst noting JPMorgan (#JPM) on the 13th , WellsFargo (#WFC), Citigroup (#C) on the 14th and MorganStanley (#MS) alongside GoldmanSachs (#GS) on the 15th. For ExxonMobil, their earnings are set to be released later on today.The company in our view has long term potentially considering their activities in the Esequibo region off the coast of Guyana, in addition to their consolidation in the Persian basin. In our view, given the recent developments in Venezuela where a regime change occurred which tended to threatened XOM’s oil production activites in Guyana, the company may be more optimistic for the future. In turn, in their forward guidance should Exxon imply that they may be in a better position to leverage their investments in the region, it may be seen as a positive for the company which in turn could aid their stock price. Moreover, the main factor which may drive the company’s stock price today, is wether they are able to beat the EPS expectations of 1.67 and the revenue forecast of 80.94B placed by analysts. An EPS and revenue beat could aid the company’s stock price and vice versa.
CES 2026 is underway
CES 2026, the annual consumer tech conference held in Las Vegas is underway. The trade show is an annual event hosted in Nevada where presentations of new products and technologies in the consumer electronics industry are unveiled. Notable companies include Nvidia (#NVDA), whose CEO gave a keynote speech last year. Hence the event is worth monitoring as new products or technologies unveiled by companies could influence their respective stock prices and in the event of a key player such as Nvidia it may have broader market implications.
Technical analysis
US500 daily chart
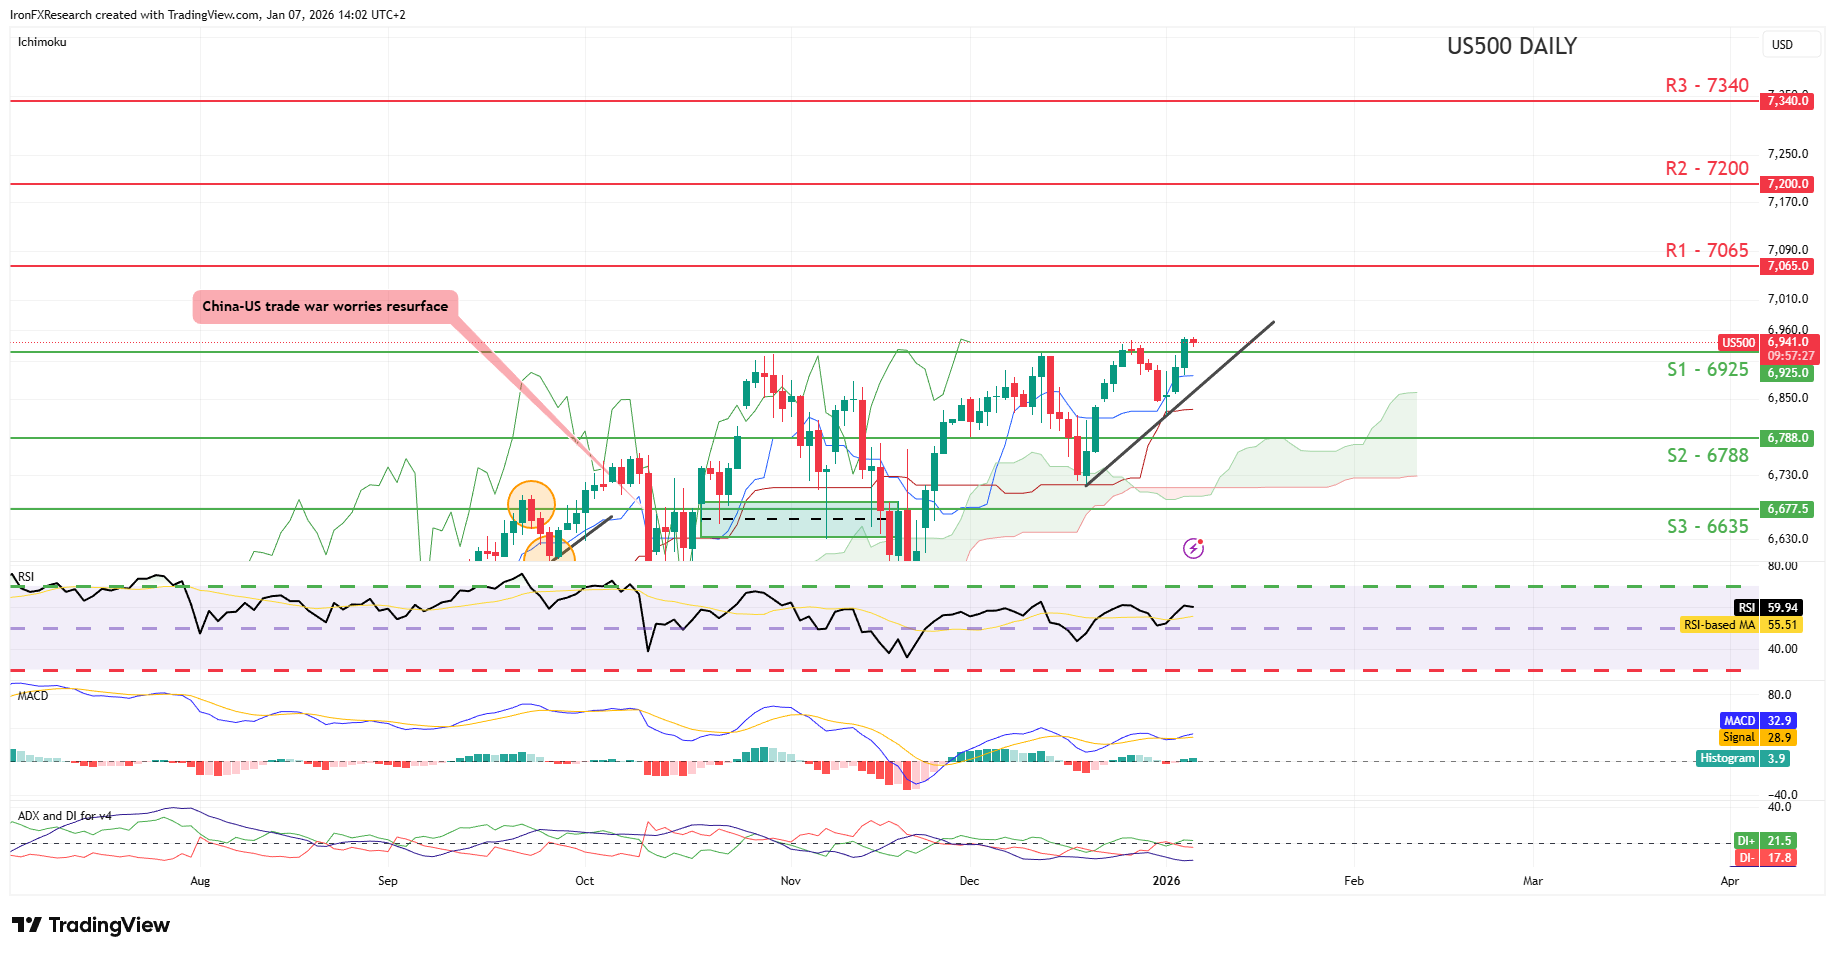
- Support: 6925 (S1), 6788 (S2), 6635 (S3).
- Resistance: 7065 (R1), 7200 (R2), 7340 (R3).
On a technical level, we note that the index appears to be moving in an upwards fashion. We opt for a bullish outlook for the index and supporting our case is the index clearing our former resistance, now turned to support at the 6925 (S1) support level, which was also the prior all-time high figure for the index. For our bullish outlook to be maintained we would require the index to remain above our 6925 (S1) support line if not also a break above our 7065 (R1) hypothetical resistance level, with the next possible target for the bulls being our 7200 (R2) hypothetical resistance line. On the other hand, for a bearish outlook we would require a clear break below our 6925 (S1) support level with the next possible target for the bears being our 6788 (S2) support line. Lastly, for a sideways bias we would require the index to remain confined between our 6925 (S1) support level and our 7065 (R1) resistance line.
Author

Phaedros Pantelides
Independent Analyst
Mr Pantelides has graduated from the University of Reading with a degree in BSc Business Economics, where he discovered his passion for trading and analyzing global geopolitics.