Equities report: The Equities bloodbath continues

The bloodbath in the US Equities markets continues as tariffs blows are being thrown between the US and China . In todays’ report we are to discuss the recent developments in the ongoing trade wars and the release of the Fed’s meeting minutes and US CPI rates. We are to conclude the report with a technical analysis of S&P 500’s daily chart for a rounder view.
Trump’s “Liberation Day” turns into Doomsday week
President Trump’s “Liberation Day” occurred last week. The US announced a base 10% tariff on all imports into the US. Moreover, the US Government announced widespread tariffs with the EU facing a 20% tariff and China an additional 34% on top of the pre-imposed 20% tariff, bringing the total to 54% following the announcement. The decision by the US has been met with widespread criticism, with the EU seemingly preparing to retaliate against the US, with the EU Foreign Affairs council releasing a statement in which it is said that “ministers also addressed the possibility of further proportionate countermeasures if needed” which could be a reference to the possible 25% retaliatory tariff from the EU which has been touted by various media outlets. Moreover, since the announcement of the additional 34% tariff on China, both nations having been trading blows back and forth with one another. Starting with China retaliating with a 34% tariff, prompting the US to announce another 50% which has now resulted in China announcing a further 50% tariff on US goods. Therefore, as things stand, the US has imposed an 104% tariff on Chinese goods and China has imposed an 84% tariff on US goods. The matter at hand is extremely volatile, with the dynamic situation changing on an hourly basis and thus we would not be surprised to see the US announcing further tariffs after this report has concluded. In turn the ongoing trade war and the continued escalation of the blows being traded between China and the US may weigh on the US equities markets, as the uncertainty surrounding the global economic outlook continues to mount. Our take on the ongoing trade war is that all sides are attempting to garner as much leverage as possible before heading to the negotiation table in order to find an amicable trade deal. Yet, having seen the lengths to which the US and China are willing to is concerning to say the least. It appears that both sides are playing a game of ‘chicken’ and waiting to see who bows out first. In conclusion, we would not be surprised to see the ongoing trade wars weighing on the US equities markets in the near future until the dust finally settles and the US showcases a clear willingness to go back to the negotiating table to reach an amicable trade deal with its trading partners.
US FOMC Minutes and CPI rates
The FOMC’s last meeting minutes are set to be released today. Should the minutes showcase concern by policymakers for the resiliency of the US economy, it may imply that the bank could prepare to cut rates in the near future in an attempt to aid the US economy, which in turn could aid the US Equities markets. On the other hand, should policymakers raise their concerns about a possible resurgence of inflationary pressures it may imply that they could remain on hold which in turn may weigh on the US stock markets. Moreover on Thursday the US CPI rates for March are set to be released this week as well. In the event that the CPI rates showcase stubborn or even an acceleration of inflationary pressures it may spell disaster for the Fed as worries about a possible recession mount, with JP Morgan CEO Jamie Dimon also stating that a recession is a “likely outcome”, it may weigh on the US stock markets. Yet should the CPI rates showcase easing inflationary pressures it may provide the Fed with some leeway should they wish to cut rates in the near future which in turn could aid the US Equities markets.
Technical analysis
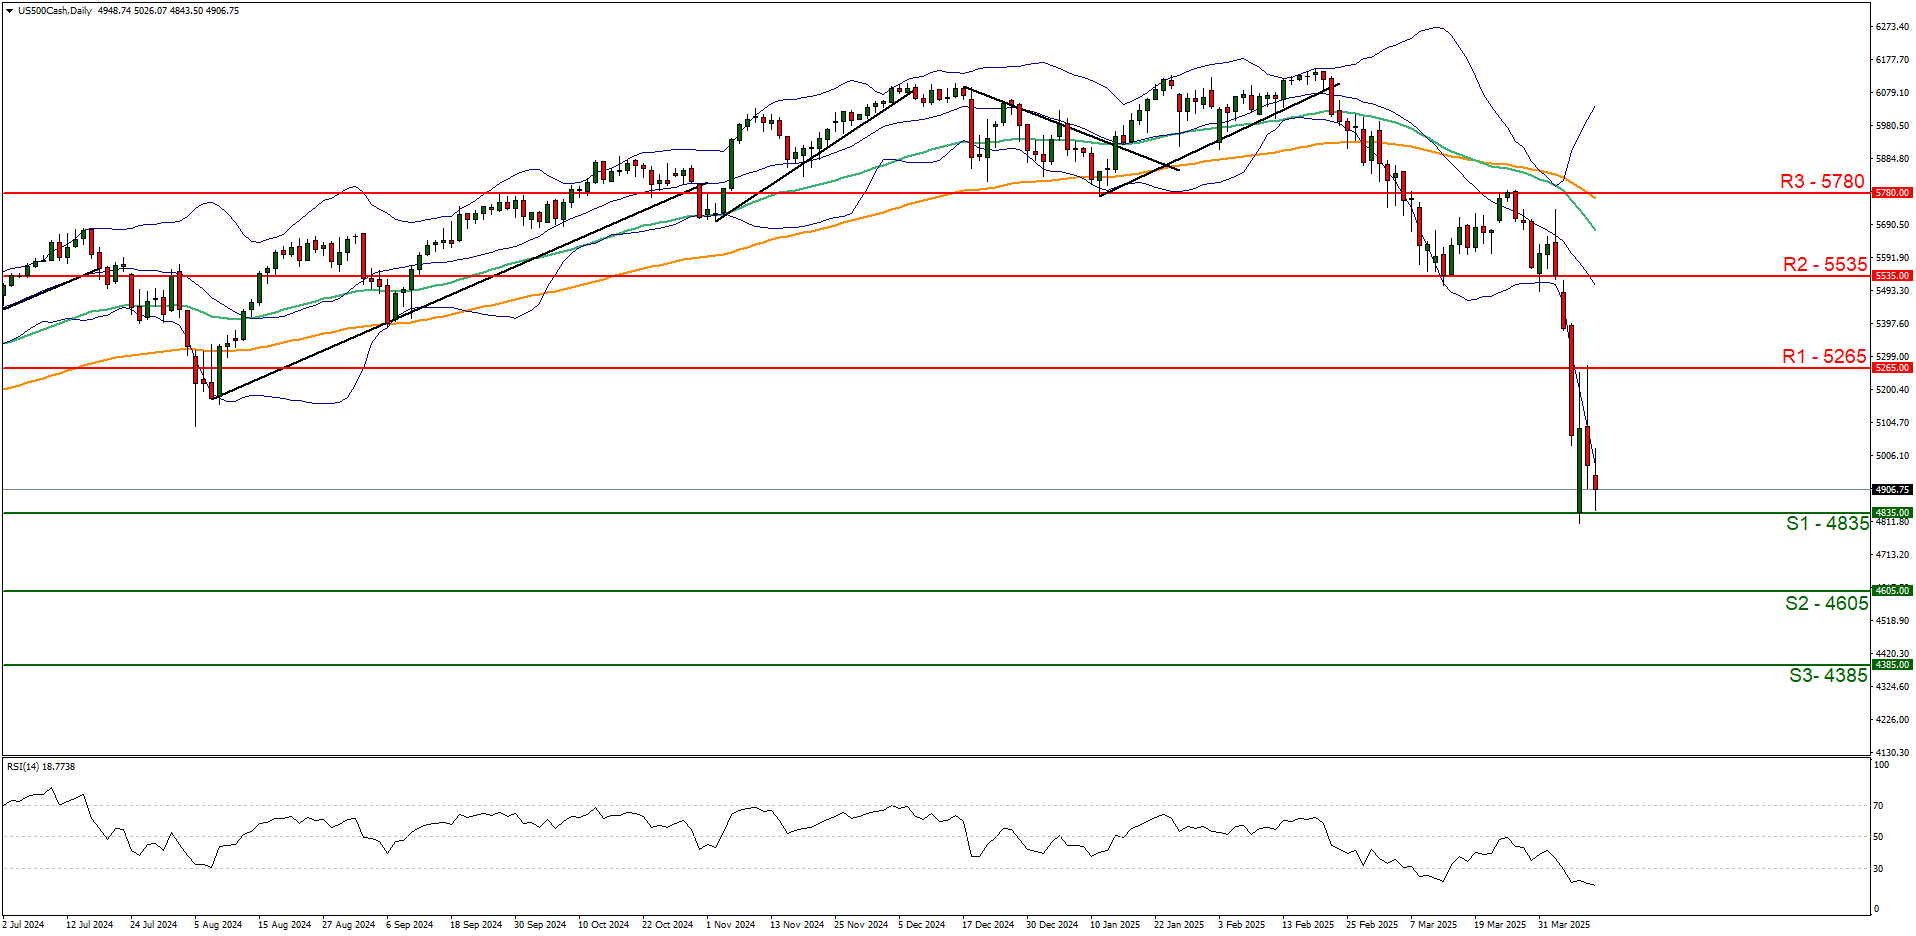
US500 daily chart
-
Support: 4835 (S1), 4605 (S2), 4385 (S3).
-
Resistance: 5265 (R1), 5535 (R2), 5780 (R3).
The S&P500 appears to be moving in a downwards fashion, marking a dramatic turn of events. We opt for a bearish outlook for the index and supporting our case is the RSI indicator below our chart which registers a figure below 20, implying a strong bearish market sentiment. Yet at that figure, it may also imply that the index is oversold and may be due a correction to higher ground. Nonetheless, for our bearish outlook to continue we would require a break below the 4835 (S1) support level with the next possible target for the bears being the 4605 (S2) support line. On the flip side for a sideways bias we would require the index’s price to remain confined between the 4835 (S1) support level and the 5265 (R1) resistance line. Lastly, for a bullish outlook we would require a clear break above the 5265 (R1) resistance line with the next possible target for the bulls being the 5535 (R2) resistance level.
Author

Phaedros Pantelides
IronFX
Mr Pantelides has graduated from the University of Reading with a degree in BSc Business Economics, where he discovered his passion for trading and analyzing global geopolitics.


