Equities report: FOMC Minutes due out today

The S&P500 appears to be slightly in the reds for the day, as participants eagerly await the release of the Fed’s January meeting minutes later on today. In the current report, we’ll take a look at the aforementioned FOMC meeting minutes, whilst ending our report with the technical analysis of the S&P 500’s daily chart.
FOMC January meeting minutes due out today
The FOMC’s January meeting minutes are set to be released during today’s American trading session. The minutes may provide insight into the Fed’s inner deliberations when they decided to remain on hold during their first meeting of the year last month. As a reminder, Fed Chair Powell during his bi-annual testimony to Congress stated that the US employment market remains tight and inflation, despite still being above the banks’ 2% target, has slowed down. Since Fed Chair Powell’s testimony, we have received the US CPI rates for January which showcased an unexpected acceleration of inflationary pressures, with the headline CPI rate on a year-on-year level coming in at 3.0% versus the expected and prior rate of 2.9%. The hotter-than-expected CPI inflation print may imply that the Fed could withhold from resuming its rate-cutting cycle, as was implied by Fed Governor Bowman who stated yesterday that disinflation “may take longer than we would hope”. However, we must state that during the Fed’s meeting, the CPI rates were not yet released. Thus, with the Fed having remained on hold, we would not be surprised to see the minutes showcasing concern amongst policymakers regarding the possibility of sticky inflationary pressures in the US economy. Hence, should the Fed minutes showcase a willingness by the Fed to remain on hold for a prolonged period of time, it may be perceived as hawkish in nature which could in turn aid the dollar. On the other hand, should the minutes showcase a willingness by the Fed to resume their rate cutting approach, it may be perceived as dovish which could then weigh on the dollar.
Trade tensions in view
US President Trump continues on the tariff warpath. In particular, the President announced on Tuesday that he is planning on imposing a 25% tariff on auto imports, as well as semiconductors and pharmaceuticals with final details set to be revealed on the 2nd of April. According to the FT President Trump also stated “It’ll be 25 per cent and higher and it’ll go very substantially higher over the course of the year”, but is designed in a way that would allow firms enough time should they wish to relocate their operations to the US. The possibility of tariffs on semiconductors could hurt the operations of tech firms that do not manufacture chips in the US or are heavily reliant on foreign companies. As such, we remain vigilant about the final details on the alleged tariffs as they could impact the markets.
Technical analysis
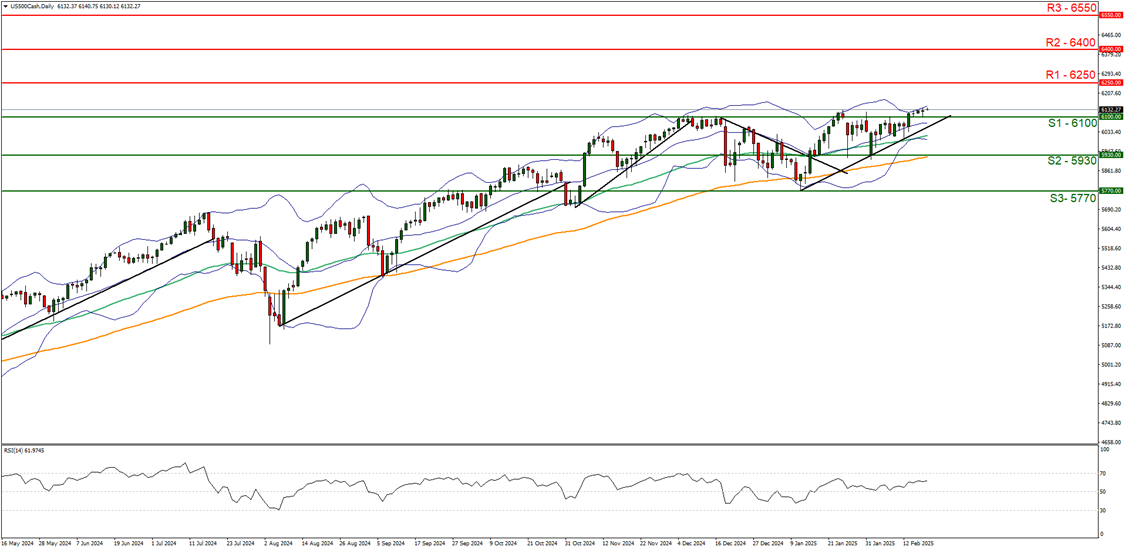
US500 daily chart
-
Support: 6100 (S1), 5930 (S2), 5770 (S3).
-
Resistance: 6250 (R1), 6400 (R2), 6550 (R3).
The S&P 500 appears to be moving in an upwards fashion to new all-time highs. We opt for a bullish outlook for the index and supporting our case is the RSI indicator below our chart which currently registers a figure near 60, implying a bullish market sentiment in addition to the upwards moving trendline which was incepted on the 13th of January. For our bullish outlook to continue we would require a break above the 6250 (R1) possible resistance level, with the next possible target for the bulls being the 6400 (R2) resistance line. On the other hand for a bearish outlook we would require a clear break below the 6100 (S1) support level, with the next possible target for the bears being the 5930 (S2) support base. Lastly, for a sideways bias we would require index to remain confined between the 6100 (S1) support level and the possible 6250 (R1) resistance level.
Author

Phaedros Pantelides
IronFX
Mr Pantelides has graduated from the University of Reading with a degree in BSc Business Economics, where he discovered his passion for trading and analyzing global geopolitics.


