Equities and the dollar under pressure as political fallout continues for Trump

Market Overview
The political fallout for Donald Trump following his reaction to Charlottesville is suddenly spilling into the markets, with the dollar under pressure and equities selling off. Rumours of that key members of his administration were upset over his response this week and could be close to resignation have further dented any expectation that Trump could achieve anything in Congress. Yesterday the suggestion was that Gary Cohn, an economic advisor and someone that has been touted as a potential successor to Janet Yellen as Fed chair, was ready to quit. This sent US equities tumbling, with the 274 drop on the Dow the biggest in three months. Treasury yields plunged and the dollar is once more under pressure. The terrorist attack in Barcelona yesterday afternoon has also added to the impending negative sentiment across markets. The VIX volatility spiked sharply higher from under 12 to 15.5 last night as traders’ fear of a marked decline impacted. This deterioration in sentiment and push into safety of Treasuries and the yen has hit Asian equities overnight and subsequently into the European session today.
Wall Street was sharply lower into the close last night with the S&P 500 -1.5% at 2430, whilst in Asia the Nikkei was down -1.2% as the yen strengthened. European markets are similarly negative in early moves today. In forex, there is a continuation of the dollar weakness that hit into the close last night, although a mild bounce in Treasury yields is helping to mitigate the dollar weakness to an extent. In commodity markets, gold is beginning to find upside traction again, whilst oil is initially stable with WTI back around its key medium term pivot at $47.00.
It is a fairly quiet day on the economic calendar to end the week. Canadian CPI inflation is at 1330BST and is expected to be flat month on month which would increase the year on year reading to +1.2% (from +1.0% last month), whilst core CPI will also be watched having been +0.9% last month. The preliminary reading of the University of Michigan Sentiment is at 1500BST and is expected to improve to 94.0 from last month’s upwardly revised 93.4.
Chart of the Day – EUR/GBP
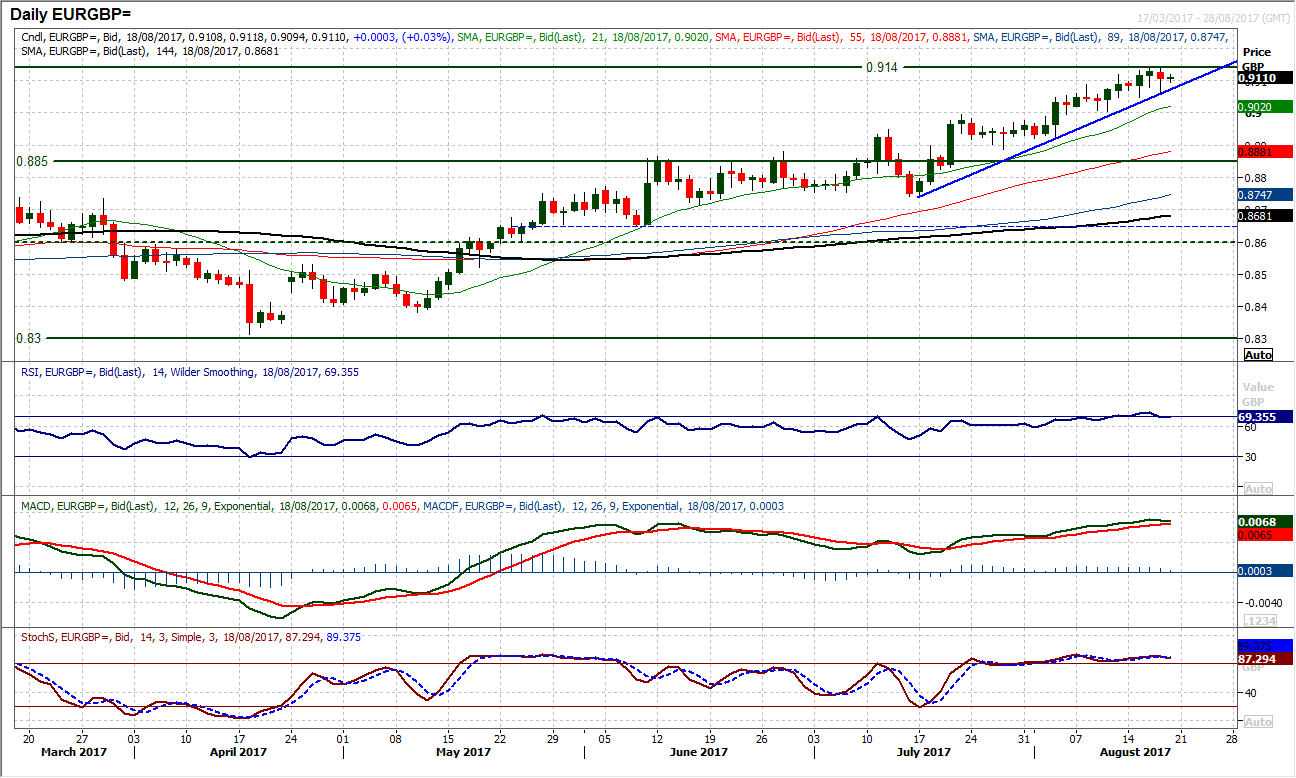
Euro/Sterling has almost been a one way bet since early May. There has been the odd near term corrective pullback, however the outlook has remained strong throughout and momentum indicators have been strongly configured to suggest that corrections are a chance to buy. Several analysist are now calling for the rally to continue towards parity in the coming months. However a key near term crossroads has now been reached. The £0.9140 resistance of a reaction high in October is the key multi-year resistance on the pair (aside from the day of the sterling flash-crash where price liquidity was sporadic to say the least). The market has tested the resistance throughout this week but as yet the barrier remains intact. This comes as momentum remains strongly configured, with the RSI around 70 along with strong MACD and Stochastics. Is the market ready to breakout? The hourly chart reveals a slight waning of momentum with the hourly RSI dropping back towards 30 yesterday and MACD lines showing a slight negative divergence. The support at £0.9050/£0.9060 is now key after yesterday’s intraday rebound. The support of a five week uptrend comes in at #0.9075 today and it is hard to bet against it, but the hourly chart is throwing up a few questions the bulls need to answer. A closing breakout above £0.9140 would effectively open parity although there would be some regard given to the flash-crash high at £0.9365. The support of this week’s lows 0.9050/0.9060 are key.
EUR/USD
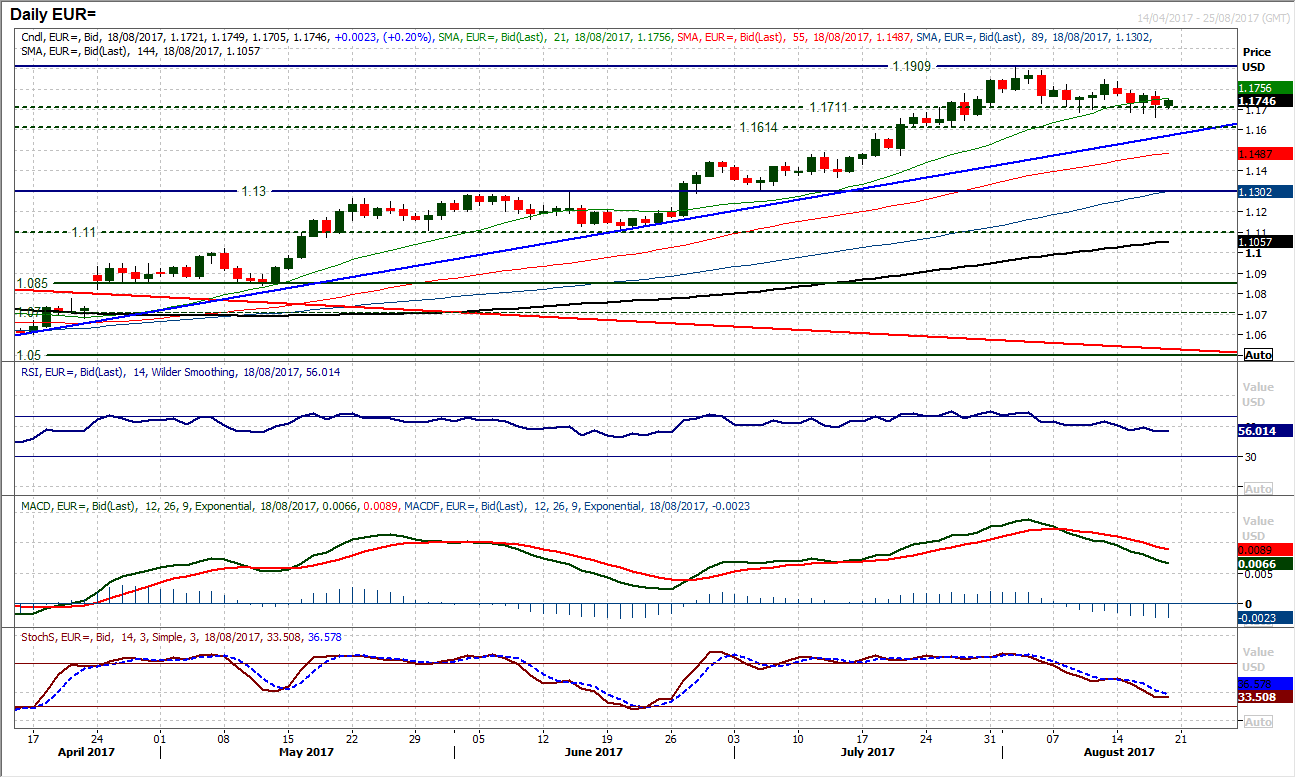
The euro came under pressure yesterday in the wake of the ECB minutes but has somehow managed to hold on to the old long term breakout support of $1.1711 on a closing basis, however the threat of a correction continues. The intraday dips below this long term level are being seen now on a daily basis as the market continues to chip away at the relevance of this support. This comes as momentum indicators are corrective with the continued slide in the RSI, MACD and Stochastics lines. The market has ticked mildly higher again today but yesterday’s high at $1.1790 which is below the already lower high at $1.1845, now takes on added importance. A continues failure at lower highs, with corrective momentum suggests ongoing pressure for the decisive breach of $1.1711 and a move back towards the uptrend which today comes in at $1.1585. The hourly momentum is not excessively negative although there is a negative bias.
GBP/USD
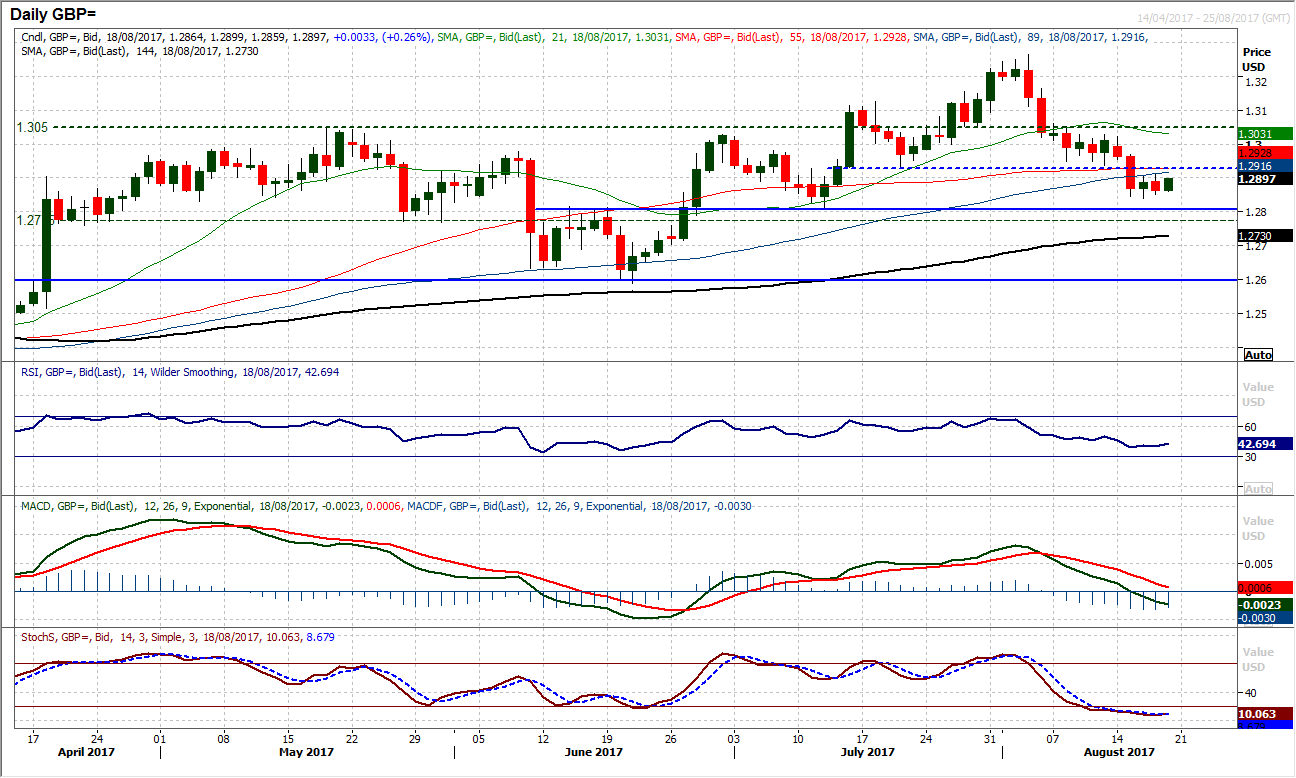
The breakdown below $1.2930 continues to be the key chart development as it now suggests a continued corrective move. The run of lower highs and lower lows in conjunction with the breakdown of $1.2930 suggests a retreat to test the July low at $1.2808. Rallies are subsequently seen as a chance to sell. The market has consolidated to an extent in the past couple of sessions but the overhead supply between $1.2930/$1.3030 suggests that any rebound will struggle. Momentum indicators remain negatively configured with the Stochastics now firmly bearish, whilst the MACD lines are set to move below neutral imminently whilst the RSI toys with a move below 40. This week’s low at $1.2840 is initially supportive but the hourly chart suggests that this is a consolidation rather than the development of a base pattern and the support is likely to come under further threat once this consolidation has played out.
USD/JPY
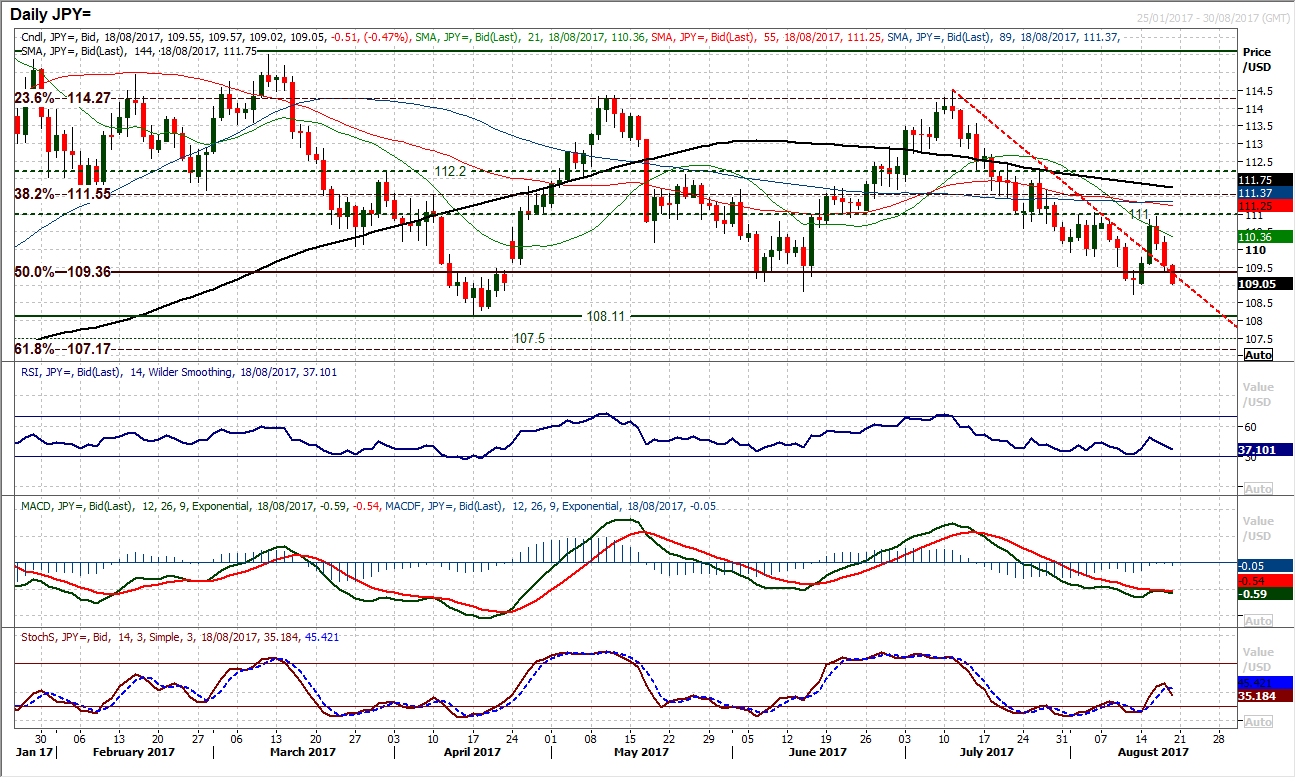
There was a point during yesterday’s session where it looked as though the dollar bulls may be set to regain control, but that was quickly snuffed out as US traders decisively sold and another strong bear candle has formed. The concern is that with the market falling back further this morning, the momentum indicators are beginning to find downside traction once more. Coming after a period of rebound that has helped to renew downside potential, the momentum could now be set for further downside in the price. The Stochastics have rolled over around 50, whilst the RSI has similarly dropped back below 40 now. The 50% Fibonacci at 109.35 is being tested again but the earlier low from August at 108.73 is once more in prime view. The negative momentum configuration on the hourly chart shows rallies now being sold into and any move to unwind the hourly RSI towards 50 is an opportunity. Initial resistance is 109.60.
Gold
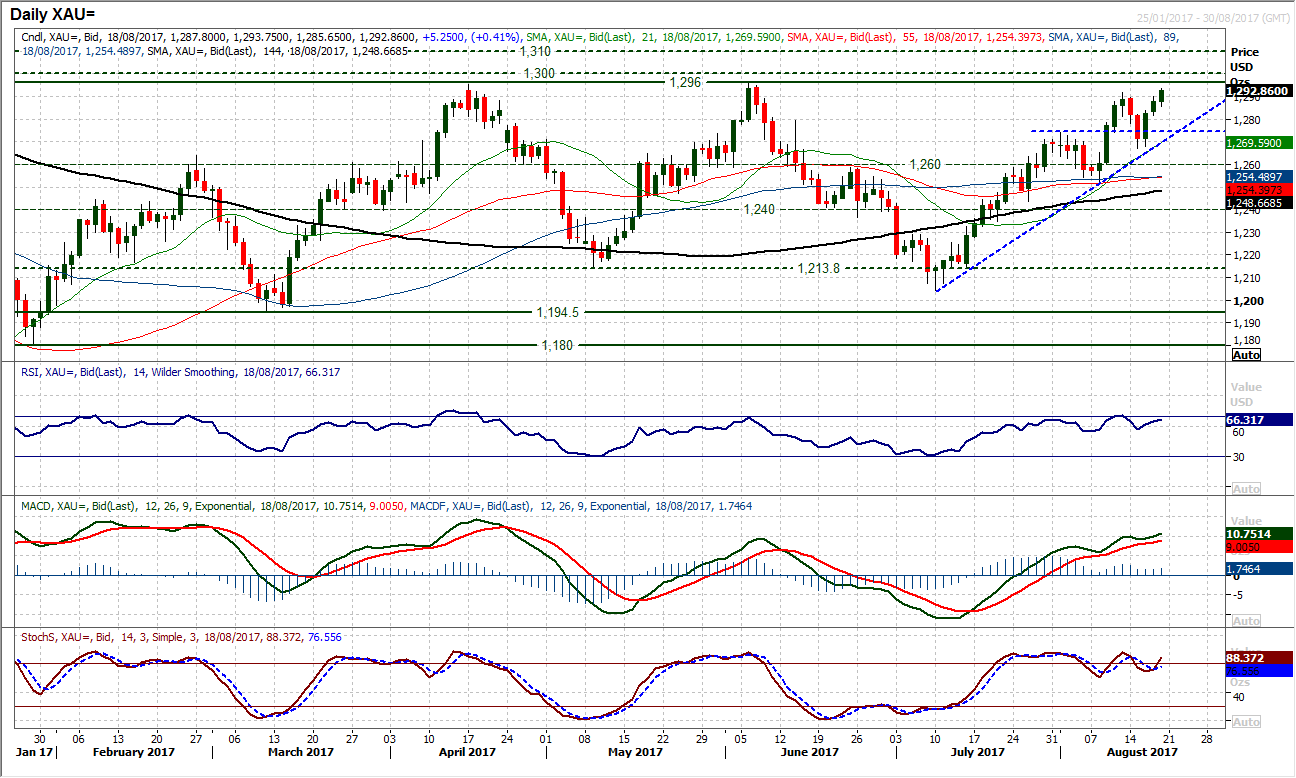
Gold ran higher again yesterday with another positive candle that will put the pressure on the overhead resistance of the August high at $1291.90. However it is interesting to see how much the bulls have left in the tank. After the very early gains yesterday, the buyers were not especially interested in pushing the market through the key levels of resistance that lie between $1290/$1300. Daily momentum remains positively configured but there is still a hint that this could begin to turn into a consolidation again. Yesterday’s low at $1281 will take on added near term significance now, as a failure would see the market rolling over and retreating back to the $1274 breakout once more. It would take a move above $1310 for a decisive upside break of long term resistance.
WTI Oil
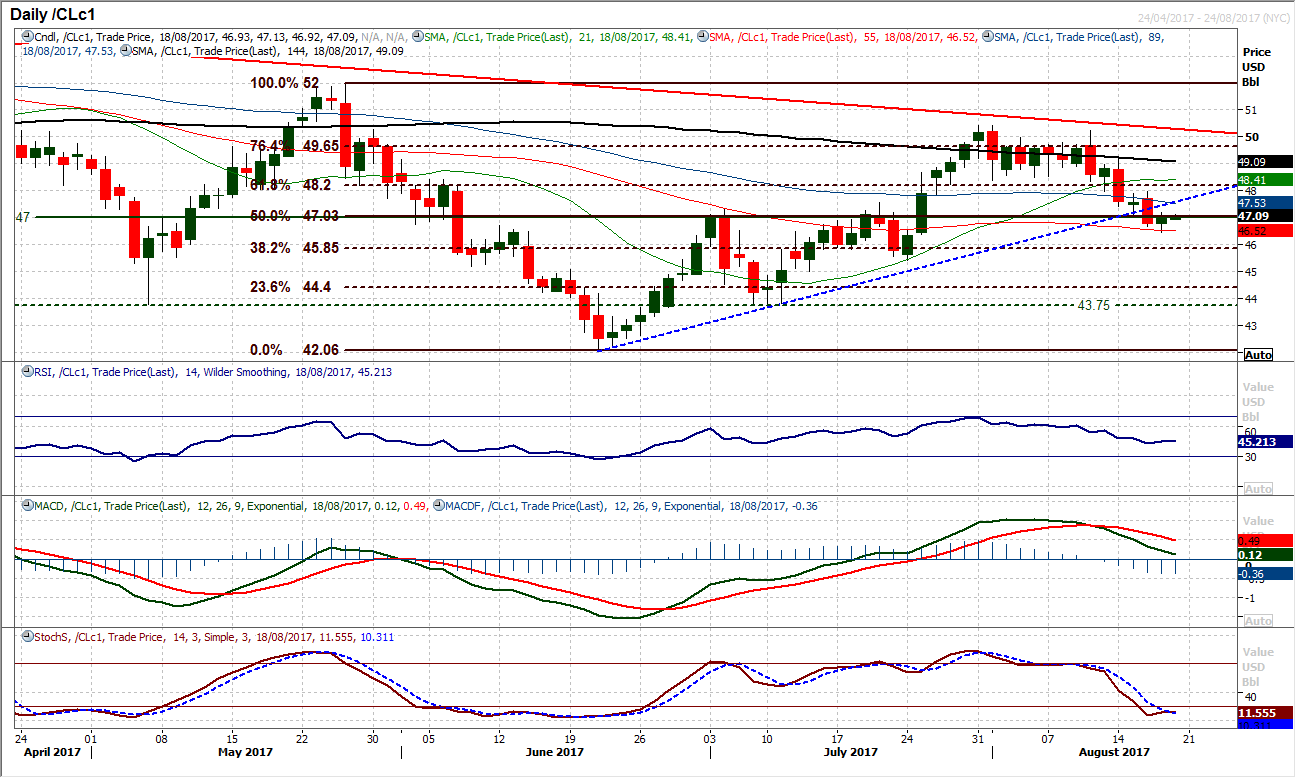
With the sequence of strong bear candles, breach of support at $47.00 and deterioration in momentum indicators, rallies have become a chance to sell. This would suggest that the old support at $47.00 is new resistance and there is now a band of resistance $47.00/$48.00 as a “sell zone”. Having broken below the medium term pivot at $47.00 the way is open for continued correction back to test the late July low at $45.40 which is also around the next Fib level at 38.2% of $52.00/$42.05 at $45.85. The hourly chart shows unwinding moves with the hourly RSI back to 60 and MACD lines back to neutral are now considered enough for the next opportunity to sell. Yesterday’s low at $46.45 is initial support.
Dow Jones Industrial Average
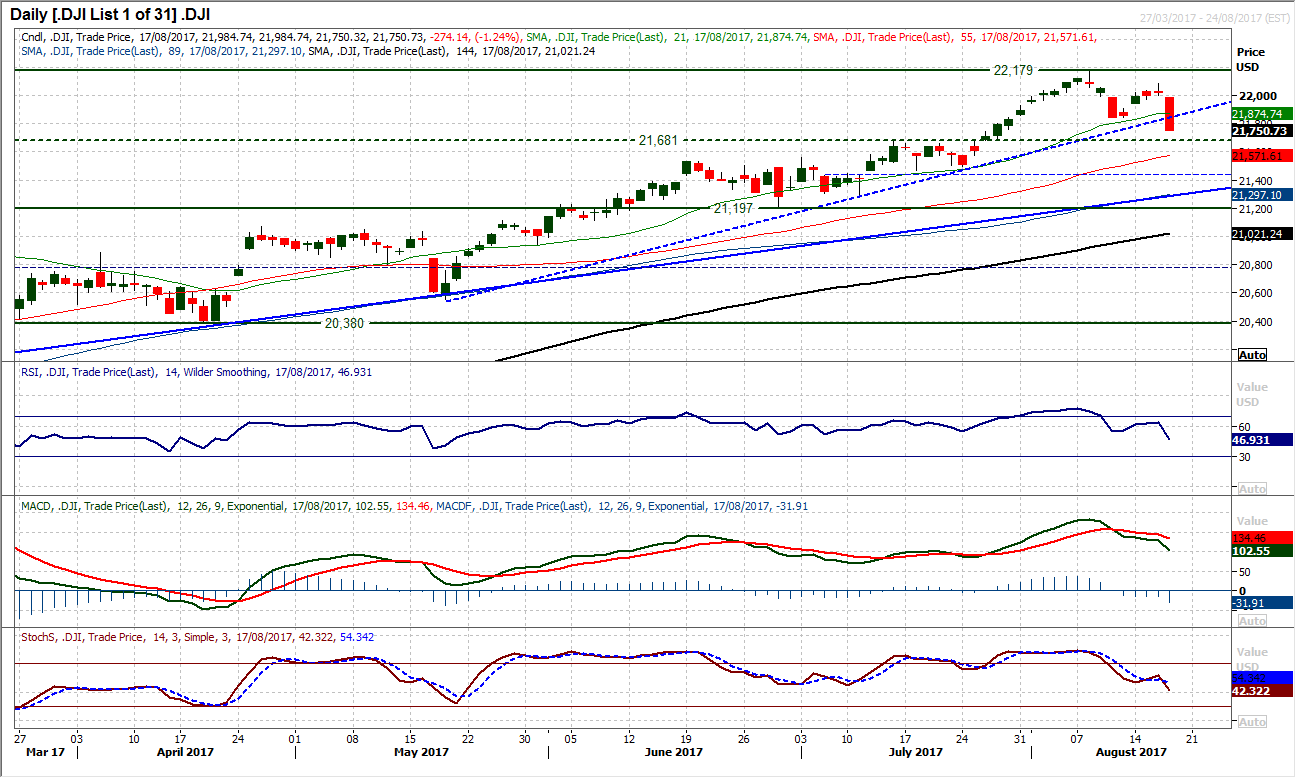
The biggest one day decline on the Dow since mid-May has changed the outlook. Political events surrounding the rumour of Gary Cohn’s resignation from the Trump administration sent shares lower yesterday. The rumours may not be accurate, but concerns over the conduct of Donald Trump are now proving to be a drag on markets where previously they were a boost. This now means a retreat has broken the support of a three month uptrend and also the Dow is beginning to post lower highs and lower lows. The market has also closed decisively below the rising 21 day moving average (currently 21,875) which has been a basis of support for several months. There is a deterioration on the momentum indicators with the Stochastics falling back to a three month low and the RSI also rolling over. This suggest that the Dow is increasingly being seen as a sell into strength. The next key test will be the breakout support at 21,681 and a decisive move below here would begin to find the bears with significant traction. The previous low at 21,844 is initial resistance now as overhead supply suddenly becomes an issue.
Author

Richard Perry
Independent Analyst


