Empire State Moves Markets
US Dollar: Dec. USD is Up at 93.305.
Energies: Nov Crude is Up at 51.89.
Financials: The Dec 30 year bond is Up 2 ticks and trading at 153.25.
Indices: The Dec S&P 500 emini ES contract is 4 ticks Lower and trading at 2555.25.
Gold: The Dec gold contract is trading Down at 1291.70. Gold is 113 ticks Lower than its close.
Initial Conclusion
This is not a correlated market. The dollar is Up+ and Crude is Up+ which is not normal and the 30 year Bond is trading Higher. The Financials should always correlate with the US dollar such that if the dollar is lower then bonds should follow and vice-versa. The indices are Lower and Crude is trading Up+ which is correlated. Gold is trading Down which is correlated with the US dollar trading Up+. I tend to believe that Gold has an inverse relationship with the US Dollar as when the US Dollar is down, Gold tends to rise in value and vice-versa. Think of it as a seesaw, when one is up the other should be down. I point this out to you to make you aware that when we don’t have a correlated market, it means something is wrong. As traders you need to be aware of this and proceed with your eyes wide open.
At this hour all of Asia is trading Mixed with half the exchanges Higher and the other half Lower. As of this writing Europe is trading Mixed as well.
Possible Challenges To Traders Today
-
Import Prices m/m is out at 8:30 AM EST, this is major.
-
Capacity Utilization Rate is out at 9:15 AM. This is major.
-
Industrial Production is out at 9:15 AM EST. This is major.
-
NAHB Housing Market Index is out at 10 AM. This is major.
-
FOMC Member Harker Speaks at 1 PM EST. This is major.
-
TIC Long-Term Purchases is out at 4 PM. This is not major.
Treasuries
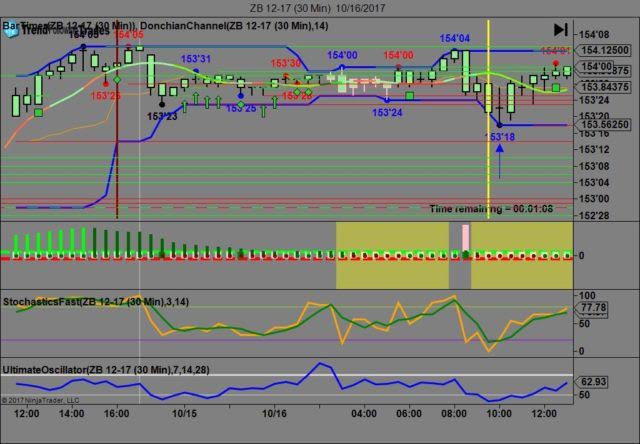
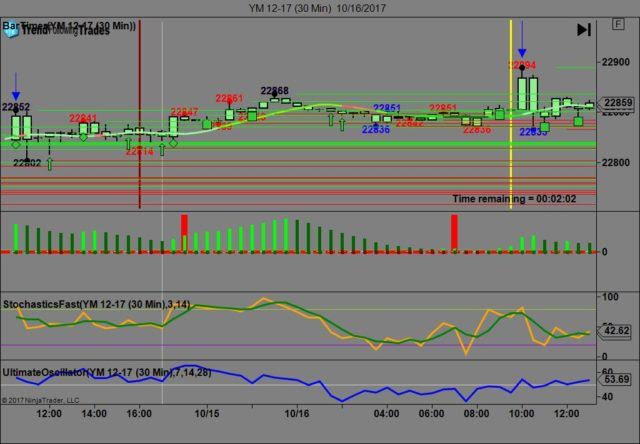
We’ve elected to switch gears a bit and show correlation between the 30 year bond (ZB) and The YM futures contract. The YM contract is the DJIA and the purpose is to show reverse correlation between the two instruments. Remember it’s liken to a seesaw, when up goes up the other should go down and vice versa.
Yesterday the ZB made it’s move at around 10 AM EST. The ZB hit a Low at around that time and the YM hit a High. If you look at the charts below ZB gave a signal at around 10 AM EST and the YM was moving Lower at the same time. Look at the charts below and you’ll see a pattern for both assets. ZB hit a Low at around 10 AM and the YM hit a High. These charts represent the newest version of Trend Following Trades and I’ve changed the timeframe to a 30 minute chart to display better. This represented a Long opportunity on the 30 year bond, as a trader you could have netted about a dozen ticks per contract on this trade. Each tick is worth $31.25. We added a Donchian Channel to the charts to show the signals more clearly. Please note that the front month for the ZB and the YM contract is now December, 2017.
Charts Courtesy of Trend Following Trades built on a NinjaTrader platform.
Bias
Yesterday our bias was neutral as the indices didn’t have any sense of direction yesterday morning, hence the neutral bias. The Dow gained 85 points and the other indices gained ground as well. Today we aren’t dealing with a correlated market and our bias is to the Downside.
Could this change? Of Course. Remember anything can happen in a volatile market.
Commentary
Yesterday’s actions begs to ask the question: can anything stop this market? Don’t get me wrong I think the idea of an ever growing market is great but reality says that what goes up must eventually come down. The last time anyone saw this type of action was in 2000 during the dot.com boom when everything just seemed to go in one direction: UP. Savvy traders know that sooner or later this will end, the question is when and how? Today we have a bit more economic news than we’ve seen previously but direction wise, only time will tell….
Author

Nick Mastrandrea
Market Tea Leaves


