|

Elliott wave view: Oil looking to break higher [Video]

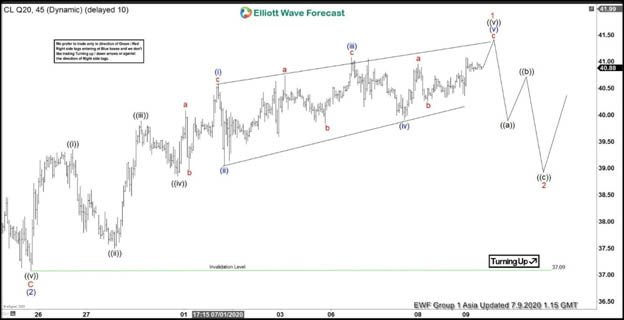
Light Crude Oil 45 minutes chart below shows that the commodity has ended wave (2) pullback at 37.09 low.  From there, the commodity extended higher, with the rally unfolding as a diagonal Elliott Wave structure. Up from that wave (2) low, wave ((i)) ended at 39.35 high and wave ((ii)) dip ended at 37.50 low. Oil then extended higher in wave ((iii)), which ended at 39.89 high. The pullback in wave ((iv)) then ended at 38.85 low.

The commodity then continued to resume higher in wave ((v)), which is unfolding as an ending diagonal Elliott Wave Structure. Up from wave ((iv)) low, wave (i) ended at 40.58 high and wave (ii) dip ended at 39.05 low. Wave (iii) then ended at 41.08 high. Wave (iv) pullback ended at 39.90 low.  Currently, wave (v) is in progress and can see another high. This would end 5 waves rally in larger degree wave 1 and also the cycle from June 25 low. Afterwards, a bigger 3 waves pullback in wave 2 should follow before oil resumes higher. As long as pullback stays above 37.09 low, expect wave 2 dips to find support in 3, 7, or 11 swings.

Oil 45 Minutes Elliott Wave Chart

Oil

Oil Elliott Wave Video

Author

Elliott Wave Forecast Team

Elliott Wave Forecast Team

ElliottWave-Forecast.com

More from Elliott Wave Forecast Team
Share:

Editor's Picks

EUR/USD trims gains, hovers around 1.1900 post-US data

EUR/USD trades slightly on the back foot around the 1.1900 region in a context dominated by the resurgence of some buying interest around the US Dollar on turnaround Tuesday. Looking at the US docket, Retail Sales disappointed expectations in December, while the ADP 4-Week Average came in at 6.5K.

GBP/USD comes under pressure near 1.3680

The better tone in the Greenback hurts the risk-linked complex on Tuesday, prompting GBP/USD to set aside two consecutive days of gains and trade slightly on the defensive below the 1.3700 mark. Investors, in the meantime, keep their attention on key UK data due later in the week.

Gold loses some traction, still above $5,000

Gold faces some selling pressure on Tuesday, surrendering part of its recent two-day advance although managing to keep the trade above the $5,000 mark per troy ounce. The daily pullback in the precious metal comes in response to the modest rebound in the US Dollar, while declining US Treasury yields across the curve seem to limit the downside.

XRP holds $1.40 amid ETF inflows and stable derivatives market

Ripple trades under pressure, with immediate support at $1.40 holding at the time of writing on Tuesday. A recovery attempt from last week’s sell-off to $1.12 stalled at $1.54 on Friday, leading to limited price action between the current support and the resistance.

Dollar drops and stocks rally:  The week of reckoning for US economic data

Following a sizeable move lower in US technology Stocks last week, we have witnessed a meaningful recovery unfold. The USD Index is in a concerning position; the monthly price continues to hold the south channel support.

XRP holds $1.40 amid ETF inflows and stable derivatives market

Ripple trades under pressure, with immediate support at $1.40 holding at the time of writing on Tuesday. A recovery attempt from last week’s sell-off to $1.12 stalled at $1.54 on Friday, leading to limited price action between the current support and the resistance.