|

Elliott Wave View: Nasdaq Wave 5 In Progress [Video]

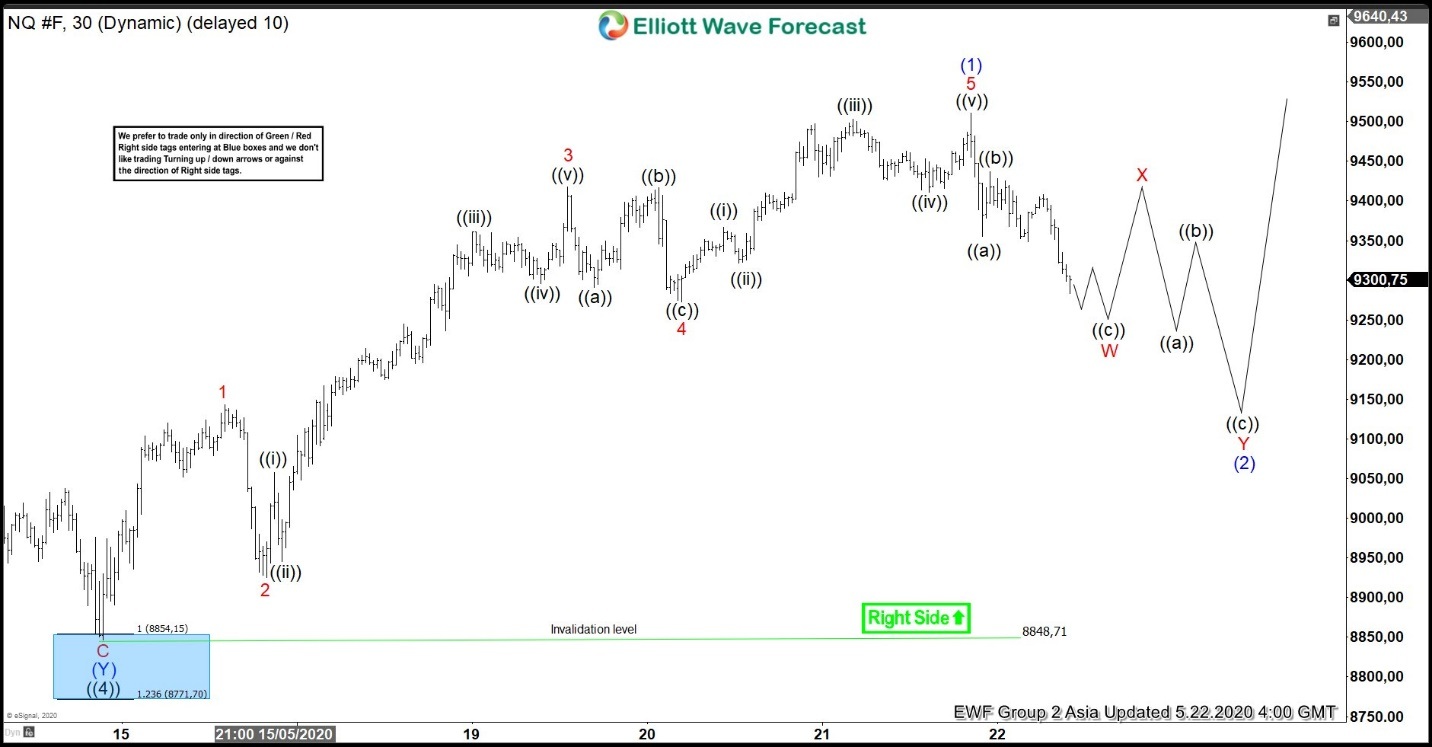
Short term Elliott Wave chart below suggests the dips to 8848.71 ended wave ((4)). This is part of a larger implusive rally which started from 3.23.2020 low. Wave ((5)) is currently in progress as 5 waves in lesser degree. Up from wave ((4)) at 8848.71, wave 1 ended at 9143, and pullback in wave 2 ended at 8925.50. Index then resumed higher in wave 3 towards 9417.25 and wave 4 pullback ended at 9273.

Final leg higher in wave 5 ended at 9510.75 and this also completed wave (1) of ((5)). Wave (2) pullback is currently in progress to correct cycle from 5.14.2020 low before the rally resumes. Internal subdivision of wave (2) is unfolding as a double three where wave W should end soon as a zigzag. Index should then bounce in wave X and then turn lower again in 3 waves to complete wave Y of (2).

Index should then resume higher again in wave (3) of ((5)) provided that pivot at 8848.71 low stays intact. Dips in the Index should find support in 3, 7, or 11 swing against 8848.71 in the first degree. If pivot at 8848.71 low fails, then Index may have ended cycle from 3.23.2020 low. In this case, a larger pullback should happen before Nasdaq resumes again.

Nasdaq (NQ_F) 30 Minutes Elliott Wave Chart

NQ_F Elliott Wave Video

Author

Elliott Wave Forecast Team

Elliott Wave Forecast Team

ElliottWave-Forecast.com

More from Elliott Wave Forecast Team
Share:

Editor's Picks

GBP/USD loses momentum, flirts with 1.3200

GBP/USD is struggling to maintain its positive bias on Thursday, retreating toward the 1.3200 region in response to the pick in the buying interest around the Greenback. That said, Cable remains under scrutiny as cautious market sentiment keeps investors focused on the US-Iran conflict and political effervescence in the UK.

EUR/USD trims gains, challenges 1.1400

EUR/USD now gives away part of its earlier advance, receding toward the 1.1400 contention zone on Thursday. Meanwhile, the pair’s recovery comes amid extra losses in the US Dollar, at the time when while investors continue to monitor developments in the Middle East and sentiment surrounding global technology stocks.

Gold remains bid and close to $4,100

Gold accelerates its recovery and approaches the key $4,000 mark per troy ounce at the end of the week, adding to Thursday’s advance. However, expectations for a hawkish Fed remain steady and keep the yellow metal’s potential upside contained.

Crypto Today: Bitcoin at $60,000, Ethereum at $1,500, and XRP at $1 face a make-or-break test

Bitcoin (BTC), Ethereum (ETH), and Ripple (XRP) are trading in the red on Friday after three consecutive days of losses, testing their respective make-or-break support levels.

Week ahead – NFP report to challenge Dollar strength and the hawkish Fed

Dollar strength dominates markets, as the hawkish Fed overshadows geopolitics and lower oil prices. NFP week could drive September Fed hike expectations and boost market volatility. The euro lacks fresh bullish catalysts, all eyes on the preliminary inflation report and the ECB Forum.

Regime change: Inside Kevin Warsh's first move to make the Fed unreadable on purpose

The rate did not move. That was the least interesting thing about Kevin Warsh's first meeting in charge of the Fed. The FOMC held its benchmark at 3.50%-3.75% for the fourth straight meeting, exactly as priced, and then the new chair used his first press conference to dismantle the machinery the market has leaned on for a decade.