|

Elliott Wave view in GBP/JPY favors upside bias

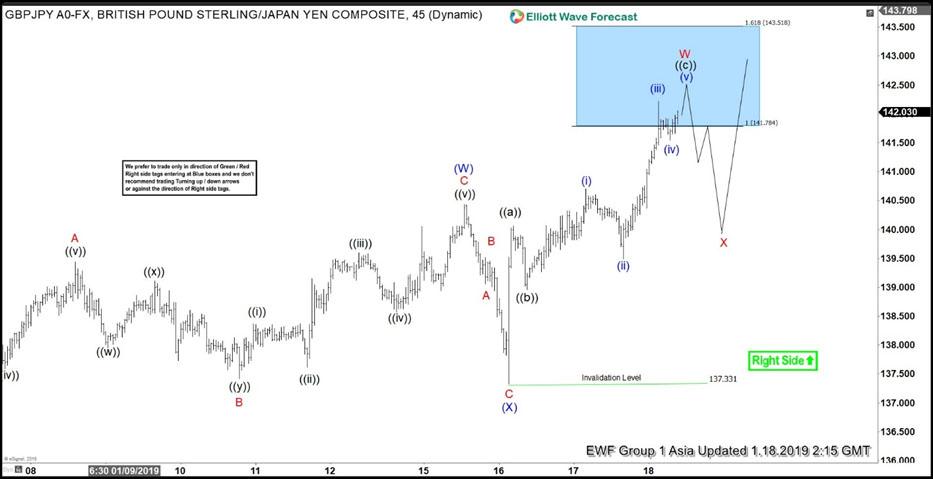
Short term Elliott Wave view on GBPJPY suggests the rally to 140.43 ended wave (W). From there, pair did a pullback to 137.33 which ended wave (X). Since then, pair has made a new high above wave (W) at 140.43, suggesting that the next leg higher in wave (Y) has started. Internal of wave (W) unfolded as a zigzag Elliott Wave structure where wave A ended at 139.44, wave B ended at 137.42, and wave C of (W) ended at 140.43.

Rally from wave (X) low at 137.33 can take various structures. One possible structure we present is a zigzag Elliott Wave structure. In this scenario, wave ((a)) ended at 140.06, wave ((b)) ended at 138.96, and wave ((c)) of W should complete soon. Pair has reached 141.78 – 143.5 area where wave W can end any moment. Once wave W is complete, it should pullback in wave X to correct cycle from 1/16/2019 low.

Wave X pullback should unfold in 3, 7, or 11 swing. As far as pivot at 137.33 low stays intact in the pullback, expect pair to extend higher again. Near-term target to the upside is 142.7 – 144, and the full 100% target is 146.08 – 148.16.

GBPJPY 1 Hour Elliott Wave Chart

GBPJPY

Become a Successful Trader and Master Elliott Wave like a Pro. Start your Free 14 Day Trial at - Elliott Wave Forecast.

Author

Elliott Wave Forecast Team

Elliott Wave Forecast Team

ElliottWave-Forecast.com

More from Elliott Wave Forecast Team
Share:

Editor's Picks

EUR/USD tests nine-day EMA support near 1.1850

EUR/USD inches lower during the Asian hours on Monday, trading around 1.1870 at the time of writing. The 14-day Relative Strength Index momentum indicator at 56 stays above the midline, confirming improving momentum. RSI has cooled from prior overbought readings but stabilizes above 50, suggesting dips could stay limited before buyers reassert control.

GBP/USD flat lines as traders await key UK macro data and FOMC minutes

The GBP/USD pair kicks off a new week on a subdued note and oscillates in a narrow range, just below mid-1.3600s, during the Asian session. Moreover, the mixed fundamental backdrop warrants some caution for aggressive traders as the market focus now shifts to this week's important releases from the UK and the US.

Gold slides below $5,000 amid USD uptick and positive risk tone; downside seems limited

Gold attracts fresh sellers at the start of a new week and reverses a part of Friday's strong move up of over $150 from sub-$4,900 levels. The commodity slides back below the $5,000 psychological mark during the Asian session, though the downside potential seems limited amid a combination of supporting factors.

Bitcoin, Ethereum and Ripple consolidate within key ranges as selling pressure eases

Bitcoin and Ethereum prices have been trading sideways within key ranges following the massive correction. Meanwhile, XRP recovers slightly, breaking above the key resistance zone. The top three cryptocurrencies hint at a potential short-term recovery, with momentum indicators showing fading bearish signs.

Global inflation watch: Signs of cooling services inflation

Realized inflation landed close to expectations in January, as negative base effects weighed on the annual rates. Remaining sticky inflation is largely explained by services, while tariff-driven goods inflation remains limited even in the US.

Ripple Price Forecast: XRP potential bottom could be in sight

Ripple edges up above the intraday low of $1.35 at the time of writing on Friday amid mixed price actions across the crypto market. The remittance token failed to hold support at $1.40 the previous day, reflecting risk-off sentiment amid a decline in retail and institutional sentiment.