Elliott Wave View Favors More Upside in BAC [Video]
![Elliott Wave View Favors More Upside in BAC [Video]](https://editorial.fxstreet.com/images/Macroeconomics/Countries/America/globe-background-gm176132618-10633045_XtraLarge.jpg)
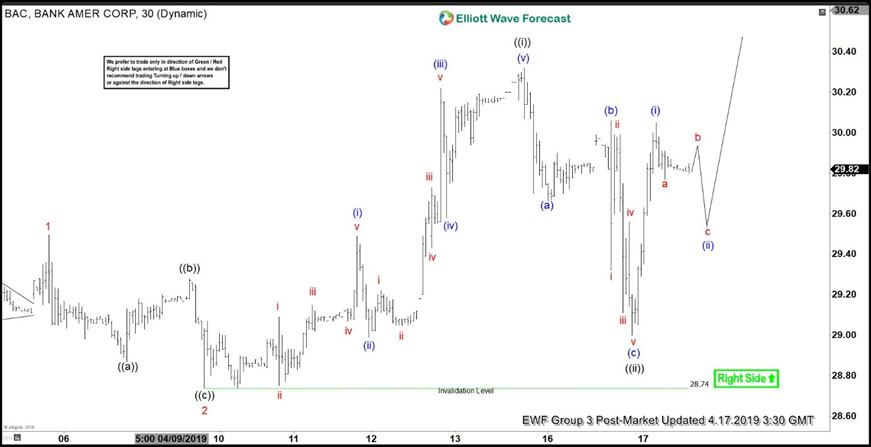
Bank of America (BAC) shows an incomplete bullish sequence from December 25,m 2018 low, favoring further upside. In the short term update below, the rally from March 26, 2019 low ($26.61) to $29.50 unfolded as an impulse and ended wave 1. The stock then pullback in wave 2 to $28.74 as an Elliott Wave zigzag structure. It has since resumed higher again within wave 3. Subdivision of wave 3 is in an impulse structure of a lesser degree.
Up from wave 2 low at $28.74, wave ((i)) ended at $30.32 and wave ((ii)) ended at $29. It still needs to break above wave ((i)) high at $30.32 to validate the view and avoid a double correction. Short term, as far as pullback stays above $28.74 in the first degree, expect BAC to extend higher. If pivot at $28.74 fails, then we can count the entire rally from March 26 low ($26.21) to $30.32 as wave 1. In this case, the stock then can do a wave 2 pullback in 3, 7, or 11 swing to correct the cycle from March 26 low before the rally resumes.
1 Hour BAC Elliott Wave Chart Asia Update
1 Hour BAC Elliott Wave Video
Become a Successful Trader and Master Elliott Wave like a Pro. Start your Free 14 Day Trial at - Elliott Wave Forecast.
Author

Elliott Wave Forecast Team
ElliottWave-Forecast.com


