|

Elliott wave Triangle pattern on Crude oil Points Higher; 60.0 per barrel is in view

Good day traders!

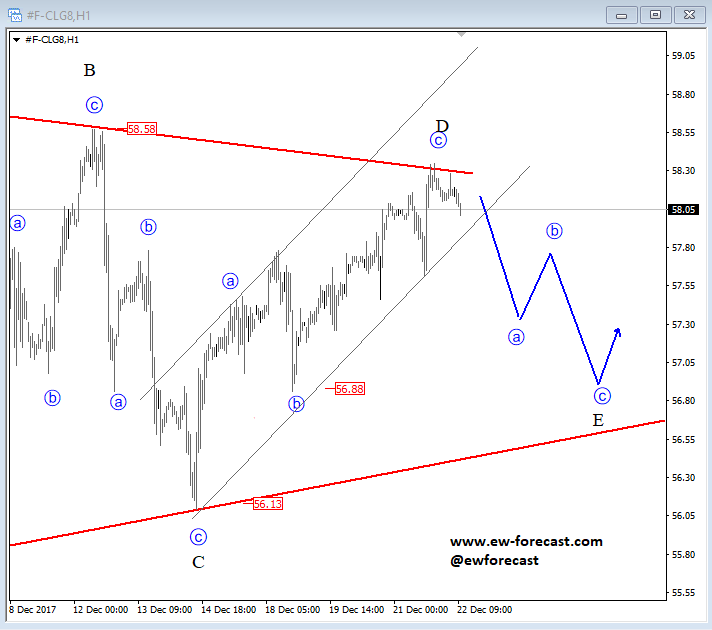
Crude oil is still trading choppy, slow and overlapping which suggests a bigger Elliott wave triangle correction to be in progress. Specifically we see price trading at the end of corrective leg D of a bigger triangle, that can see limited upside around the 58.30 level. A breach below the lower channel line would suggest a three-wave reversal within final leg E to be in progress. Support for corrective leg E can later be found at the 56.88 level, of a former swing low.

Crude oil, 1h

ElliotWave

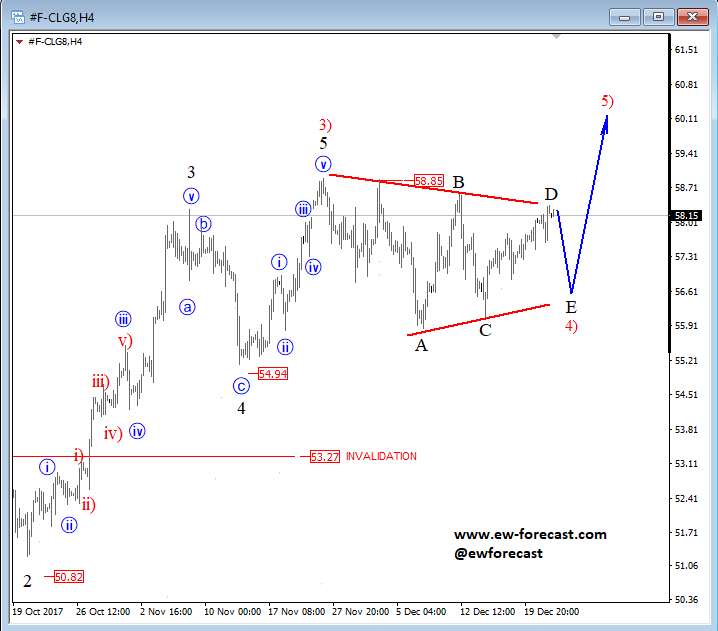
Below we have the 4h chart and its full development.

Crude oil, 4h

Oil

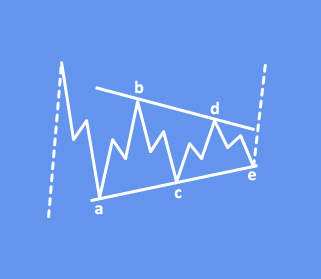
A Triangle is a common 5-wave pattern labeled A-B-C-D-E that moves counter-trend and is corrective in nature. Triangles move within two channel lines drawn from waves A to C, and from waves B to D. A Triangle is either contracting or expanding depending on whether the channel lines are converging or expanding. Triangles are overlapping five wave affairs that subdivide 3-3-3-3-3.

Triangles can occur in wave 4, wave B, wave X position or in some very rare cases also in wave Y of a combination.

Elliott wave triangle correction:

Elliot

Disclosure: Please be informed that information we provide is NOT a trading recommendation or investment advice. All our work is for educational purposes only.


You trade different markets, want to learn and be on track with trend analysis? Find out what we have to offer, and Test Our Services For 14 Days For Only 1€.www.ew-forecast.comEW-Forecast.

Author

Gregor Horvat

Gregor Horvat

Wavetraders

Experience Grega is based in Slovenia and has been in the Forex market since 2003.

More from Gregor Horvat
Share:

Editor's Picks

EUR/USD weakens as US jobs data trims Fed rate cut bets

The EUR/USD pair trades in negative territory for the third consecutive day near 1.1860 during the early European session on Thursday. Traders will keep an eye on the US weekly Initial Jobless Claims data. On Friday, the attention will shift to the US Consumer Price Index inflation report. 

GBP/USD bullish outlook prevails above 1.3600, UK GDP data looms

The GBP/USD pair gains ground near 1.3635, snapping the two-day losing streak during the early European session on Thursday. The preliminary reading of UK Gross Domestic Product for the fourth quarter will be closely watched later on Thursday. The UK economy is estimated to grow 0.2% QoQ in Q4, versus 0.1% in Q1. 

Gold remains on the defensive below two-week top; lacks bearish conviction amid mixed cues

Gold sticks to modest intraday losses through the Asian session on Thursday, though it lacks follow-through selling and remains close to a nearly two-week high, touched the previous day. The commodity currently trades above the $5,070 level, down just over 0.20% for the day, amid mixed cues.

UK GDP set to post weak growth as markets rise bets on March rate cut

Markets will be watching closely on Thursday, when the United Kingdom’s Office for National Statistics will release the advance estimate of Q4 Gross Domestic Product. If the data land in line with consensus, the UK economy would have continued to grow at an annualised pace of 1.2%, compared with 1.3% recorded the previous year. 

The market trades the path not the past

The payroll number did not just beat. It reset the tone. 130,000 vs. 65,000 expected, with a 35,000 whisper. 79 of 80 economists leaning the wrong way. Unemployment and underemployment are edging lower. For all the statistical fog around birth-death adjustments and seasonal quirks, the core message was unmistakable. The labour market is not cracking.

Sonic Labs’ vertical integration fuels recovery in S token

Sonic, previously Fantom (FTM), is extending its recovery trade at $0.048 at the time of writing, after rebounding by over 12% the previous day. The recovery thesis’ strengths lie in the optimism surrounding Sonic Labs’ Wednesday announcement to shift to a vertically integrated model, aimed at boosting S token utility.