Elliott Wave Keys for the EUR/USD this week

Imagine that you have in front of your eyes a bearish flag in the EURUSD, you feel that you must short immediately, but you do not feel confident in doing so, nor do you know how far the price can fall, these doubts abound among all traders when they see an opportunity to enter the market, fortunately here is the Elliott Wave theory it is not the holy grail but allows us to understand the complex price action to create a plan for the future. In the Elliott Wave count for this week of the EURUSD, we present a trading plan that serves to make high probability decisions.
Daily Chart
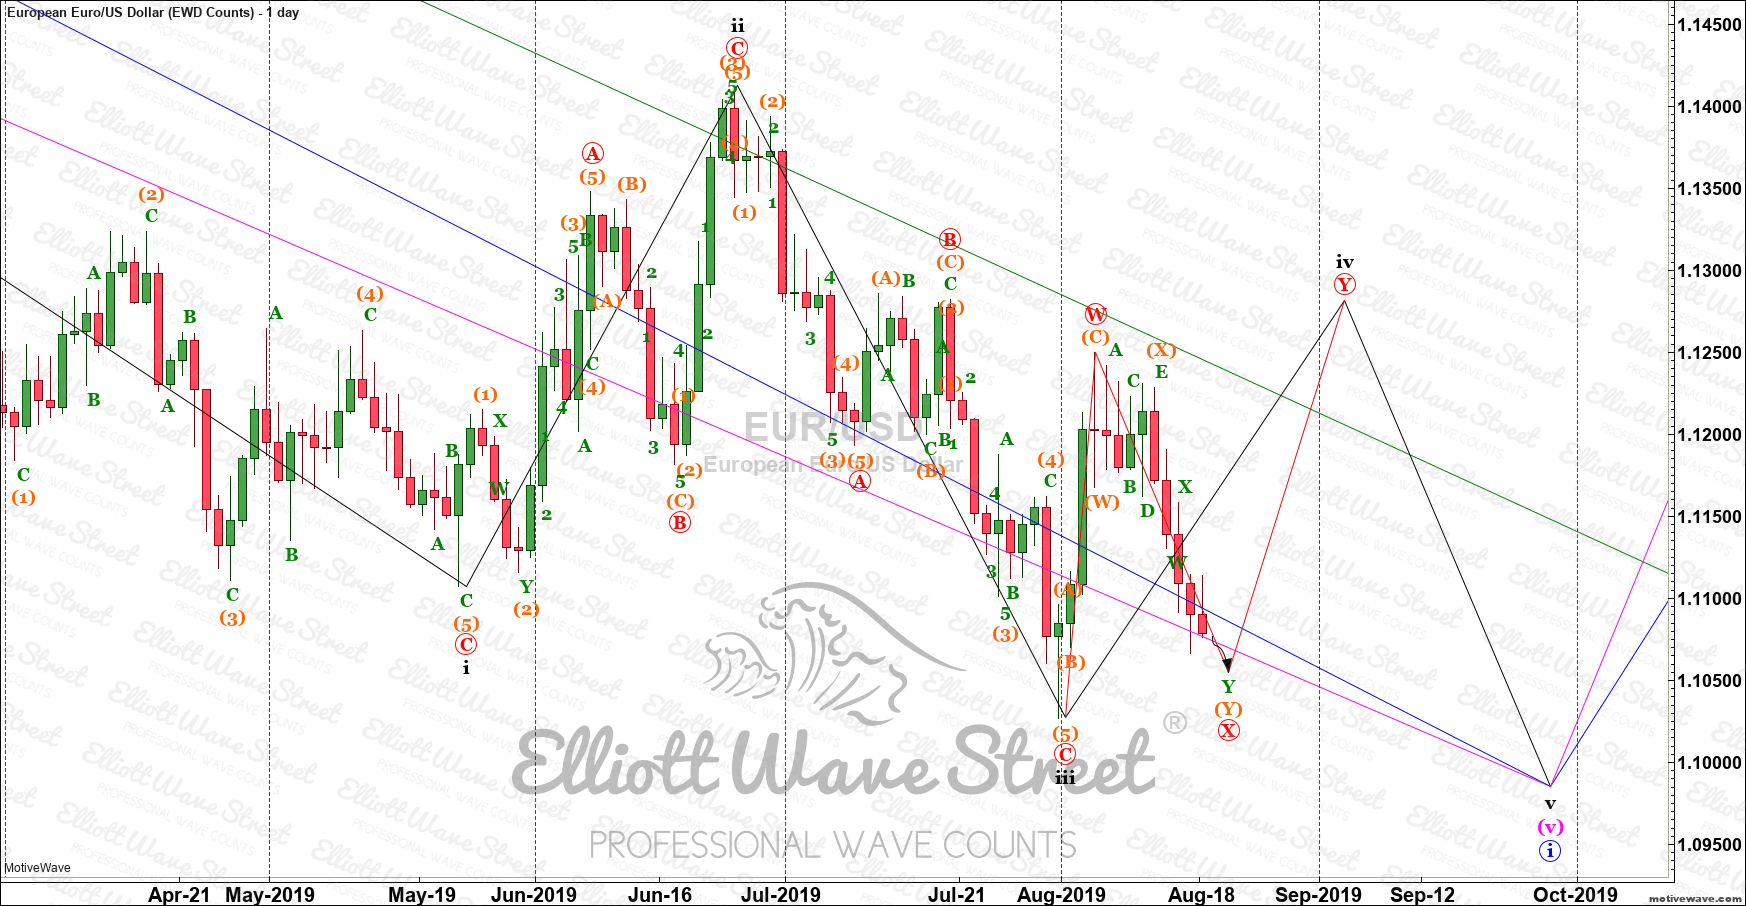
Key elements in the daily analysis
-
Wave "iv" (black) is active.
-
The minimum objective of the "iv" wave (black) is the previous high 1.1250.
-
Inside the "iv" wave (black) a corrective WXY (red) appears
-
The X wave (red) has full attention; its end will start a long trade.
-
The big question is when its end will be?
-
Now let's jump to the four-hour chart to find the trade.
4 Hour Chart
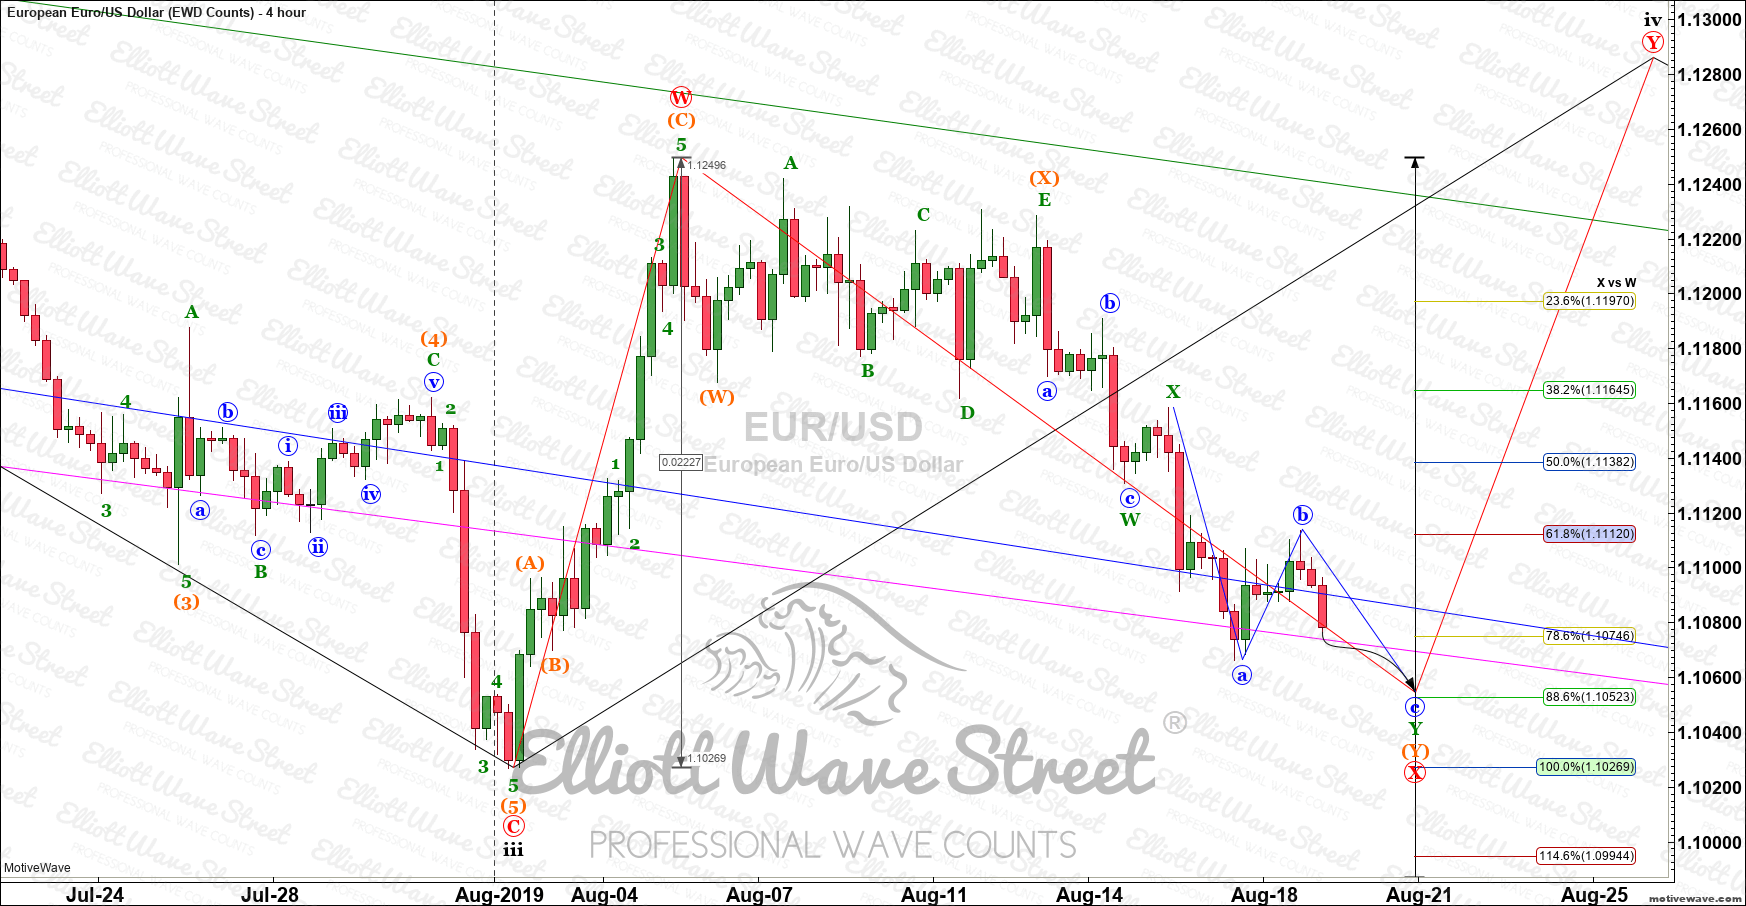
Key elements in the 4-hour analysis
-
The main objective is to find the end of the X wave (red).
-
All the tools to find the end of the trend are welcome.
-
A bearish continuation flag (wave b (blue)) appears indicating that the price needs to fall.
-
Fibonacci levels indicate that there is a support 88.6% (1.1052) where the fall can end.
-
It is time to think with a cool head and plan the strategy.
The bearish flag that appears in the graph indicates that the price can achieve a new low; this is the first condition for the future bullish trade. The price managed to break the flag and is about to create a new low (1.1066).
When the price meets the condition of reaching a new low, we will attack with all available tools to confirm the end of the X wave (red). Thus it will be possible to buy the EUR/USD and get on the bullish train. The target for the X wave (red) is 1.1052 or 88.6% Fibonacci retracement. If the price reaches the new low and bounces exceeding resistance 1.1066, there will be an attractive level to buy the pair.
It has been a pleasure to share the Elliott Wave analysis, and this information will surely help you navigate the market. See you soon and don't forget to take on trading with the best attitude.
Author

Juan Maldonado
Elliott Wave Street
Juan Maldonado has a University degree in Finance, and Foreign trade started his trading career in 2008. Since 2010 has been analyzing the markets using Elliott Wave with different strategies to spot high probability trades.


