|

Elliott Wave Analysis: Trading USD/NOK with Right Side System

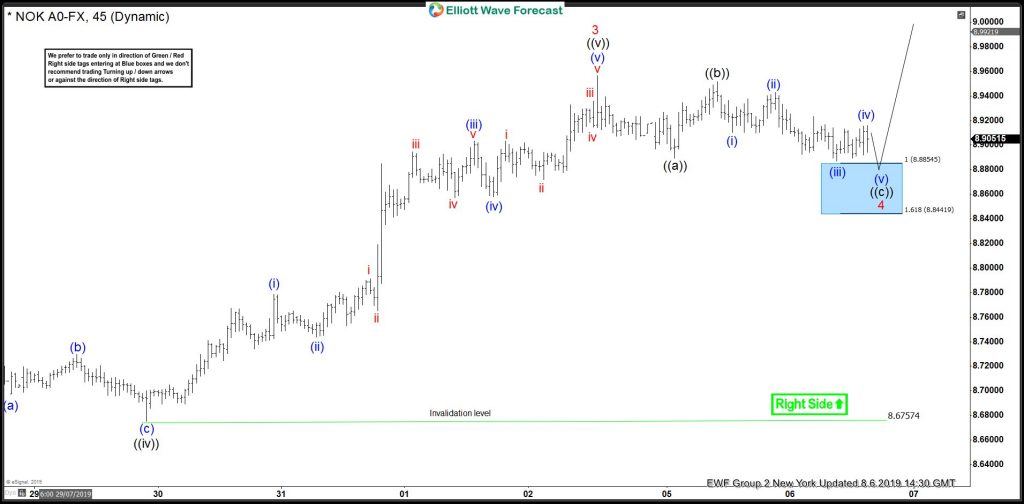
In this blog, I want to share with you some Elliott Wave charts of USDNOK which we presented to our members. In the chart below you see the 1-hour updated chart presented to our clients on the 08/6/19. The higher degree trend of the pair is to the upside and the 1-hour timeframe as well. So our members know that the right side is higher. Consequently, we advised members that we like buying the pair.

GBPAUD ended the cycle from 07/29/19 low in red wave 3 at 08/02/19 peak (8.9574). Below from there, we expected a pullback to occur in red wave 4. The pullback unfolded in an Elliott Wave Zig Zag correction structure. We advised members that USDNOK should continue higher and that we wanted to buy the pair. Therefore, we expected buyers to appear in the sequences of 3, 7 or 11 swings. At the 100 – 1.618 Fibonacci extension of black ((a))-((b)) which came at around 8.885-8.844 area and that was the first area for us to buy with a potential stop loss below 8.8441 level.

USDNOK 06.06.2019 1 Hour Chart Elliott Wave Analysis

USDNOK

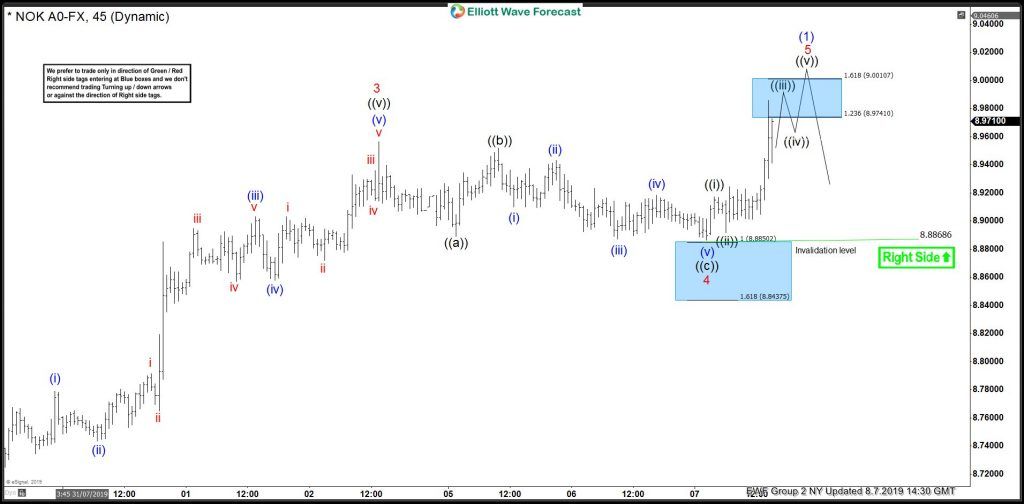
In the last Elliott Wave chart. You can see that the USDNOK reacted nicely from the blue box area. Any trades from our blue box area shown in the chart above are risk-free and already hit minimum target, or members took advantage of the blue box and made a decent profit. Please keep in mind that the 4-hour chart which I presented can have changed already. This blog should just illustrate how accurate our blue boxes are, and how our members trade our 3-7 or 11 swings strategy.

USDNOK 08.07.2019 1 Hour Chart Elliott Wave Analysis

USDNOK

Get more financial insights like these -- 100% free. Just follow this link

Author

Elliott Wave Forecast Team

Elliott Wave Forecast Team

ElliottWave-Forecast.com

More from Elliott Wave Forecast Team
Share:

Editor's Picks

EUR/USD hits two-day highs near 1.1820

EUR/USD picks up pace and reaches two-day tops around 1.1820 at the end of the week. The pair’s move higher comes on the back of renewed weakness in the US Dollar amid growing talk that the Fed could deliver an interest rate cut as early as March. On the docket, the flash US Consumer Sentiment improves to 57.3 in February.

GBP/USD reclaims 1.3600 and above

GBP/USD reverses two straight days of losses, surpassing the key 1.3600 yardstick on Friday. Cable’s rebound comes as the Greenback slips away from two-week highs in response to some profit-taking mood and speculation of Fed rate cuts. In addition, hawkish comments from the BoE’s Pill are also collaborating with the quid’s improvement.

Gold climbs further, focus is back to 45,000

Gold regains upside traction and surpasses the $4,900 mark per troy ounce at the end of the week, shifting its attention to the critical $5,000 region. The move reflects a shift in risk sentiment, driving flows back towards traditional safe haven assets and supporting the yellow metal.

Crypto Today: Bitcoin, Ethereum, XRP rebound amid risk-off, $2.6 billion liquidation wave

Bitcoin edges up above $65,000 at the time of writing on Friday, as dust from the recent macro-triggered sell-off settles. The leading altcoin, Ethereum, hovers above $1,900, but resistance at $2,000 caps the upside. Meanwhile, Ripple has recorded the largest intraday jump among the three assets, up over 10% to $1.35.

Three scenarios for Japanese Yen ahead of snap election

The latest polls point to a dominant win for the ruling bloc at the upcoming Japanese snap election. The larger Sanae Takaichi’s mandate, the more investors fear faster implementation of tax cuts and spending plans. 

XRP rally extends as modest ETF inflows support recovery

Ripple is accelerating its recovery, trading above $1.36 at the time of writing on Friday, as investors adjust their positions following a turbulent week in the broader crypto market. The remittance token is up over 21% from its intraday low of $1.12.