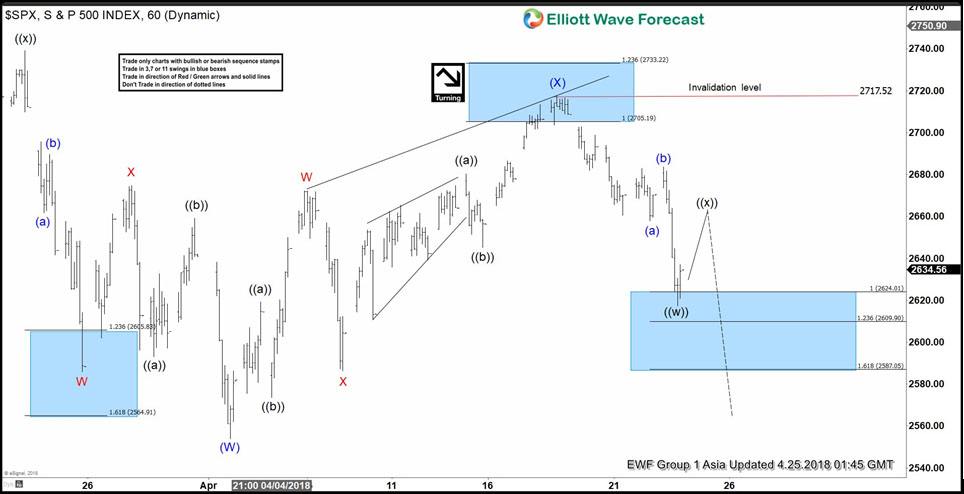
SPX short-term Elliott Wave analysis suggests that the decline to 2553.8 low ended intermediate wave (W). Above from there, the rally ended in intermediate wave (X) at 2717.49 high and the same time also completed the correction against 3/13/2018 peak (2801.9). The Index however still needs to break below wave (W) at 2553.8 low, and more importantly below 2/10 low (2532.69) to confirm that the next leg lower has started.

The internal of Intermediate wave (X) unfolded as a double three Elliott Wave structure, where Minor wave W ended at 2672.08. Minor wave X ended at 2586.27 and Minor wave Y of (X) ended at 2717.49. Down from there, the index made a 3 waves reaction lower as a zigzag Elliott Wave structure where Minute wave (a) ended at 2657.99 and Minute wave (b) bounce ended at 2683.55 high. Minute wave (c) of ((w)) appears complete at 2617.32 low. This level is within the 100%-123.6% Fibonacci extension area of Minute (a)-(b) at 2609.9 – 2624.01. Near-term, expect the index to rally in Minute wave ((x)) to correct cycle from 4/18 high (2717.52) before further downside is seen, provided that pivot at 2717.52 high stays intact.

SPX 1 Hour Elliott Wave Chart

SP500


Elliott Wave


Become a Successful Trader and Master Elliott Wave like a Pro. Start your Free 14 Day Trial at - Elliott Wave Forecast.

FURTHER DISCLOSURES AND DISCLAIMER CONCERNING RISK, RESPONSIBILITY AND LIABILITY Trading in the Foreign Exchange market is a challenging opportunity where above average returns are available for educated and experienced investors who are willing to take above average risk. However, before deciding to participate in Foreign Exchange (FX) trading, you should carefully consider your investment objectives, level of xperience and risk appetite. Do not invest or trade capital you cannot afford to lose. EME PROCESSING AND CONSULTING, LLC, THEIR REPRESENTATIVES, AND ANYONE WORKING FOR OR WITHIN WWW.ELLIOTTWAVE- FORECAST.COM is not responsible for any loss from any form of distributed advice, signal, analysis, or content. Again, we fully DISCLOSE to the Subscriber base that the Service as a whole, the individual Parties, Representatives, or owners shall not be liable to any and all Subscribers for any losses or damages as a result of any action taken by the Subscriber from any trade idea or signal posted on the website(s) distributed through any form of social-media, email, the website, and/or any other electronic, written, verbal, or future form of communication . All analysis, trading signals, trading recommendations, all charts, communicated interpretations of the wave counts, and all content from any media form produced by www.Elliottwave-forecast.com and/or the Representatives are solely the opinions and best efforts of the respective author(s). In general Forex instruments are highly leveraged, and traders can lose some or all of their initial margin funds. All content provided by www.Elliottwave-forecast.com is expressed in good faith and is intended to help Subscribers succeed in the marketplace, but it is never guaranteed. There is no “holy grail” to trading or forecasting the market and we are wrong sometimes like everyone else. Please understand and accept the risk involved when making any trading and/or investment decision. UNDERSTAND that all the content we provide is protected through copyright of EME PROCESSING AND CONSULTING, LLC. It is illegal to disseminate in any form of communication any part or all of our proprietary information without specific authorization. UNDERSTAND that you also agree to not allow persons that are not PAID SUBSCRIBERS to view any of the content not released publicly. IF YOU ARE FOUND TO BE IN VIOLATION OF THESE RESTRICTIONS you or your firm (as the Subscriber) will be charged fully with no discount for one year subscription to our Premium Plus Plan at $1,799.88 for EACH person or firm who received any of our content illegally through the respected intermediary’s (Subscriber in violation of terms) channel(s) of communication.

Recommended Content


Recommended Content

Editors’ Picks

EUR/USD alternates gains with losses near 1.0720 post-US PCE

EUR/USD alternates gains with losses near 1.0720 post-US PCE

The bullish tone in the Greenback motivates EUR/USD to maintain its daily range in the low 1.070s in the wake of firmer-than-estimated US inflation data measured by the PCE.

EUR/USD News

GBP/USD clings to gains just above 1.2500 on US PCE

GBP/USD clings to gains just above 1.2500 on US PCE

GBP/USD keeps its uptrend unchanged and navigates the area beyond 1.2500 the figure amidst slight gains in the US Dollar following the release of US inflation tracked by the PCE.

GBP/USD News

Gold keeps its daily gains near $2,350 following US inflation

Gold keeps its daily gains near $2,350 following US inflation

Gold prices maintain their constructive bias around $2,350 after US inflation data gauged by the PCE surpassed consensus in March and US yields trade with slight losses following recent peaks.

Gold News

Bitcoin Weekly Forecast: BTC’s next breakout could propel it to $80,000 Premium

Bitcoin Weekly Forecast: BTC’s next breakout could propel it to $80,000

Bitcoin’s recent price consolidation could be nearing its end as technical indicators and on-chain metrics suggest a potential upward breakout. However, this move would not be straightforward and could punish impatient investors. 

Read more

Week ahead – Hawkish risk as Fed and NFP on tap, Eurozone data eyed too

Week ahead – Hawkish risk as Fed and NFP on tap, Eurozone data eyed too

Fed meets on Wednesday as US inflation stays elevated. Will Friday’s jobs report bring relief or more angst for the markets? Eurozone flash GDP and CPI numbers in focus for the Euro.

Read more

Majors

Cryptocurrencies

Signatures