Elliott Wave analysis: Oil (CL) sets for further sell-off after bounces

Today, we will examine WTI Crude Oil Futures (CL). The commodity experienced a sell-off in July 2024. How much lower can it go? And how can traders find opportunities along the dominant path?
Looking back at the price action post-COVID, the commodity began a bullish cycle in April 2020. This bullish trend persisted throughout 2020 and 2021. Following the damage caused by COVID, the demand for energy products was strong, pushing the commodity to its second-highest price in history at $130.5 in March 2022. Structurally, the rally completed a 5-wave impulse pattern, the type generally expected in a proper trend. According to Elliott Wave theory, a 3-wave correction typically follows a 5-wave trend. This is exactly what occurred. Since the highs of March 2022, oil prices have been falling in a corrective manner. This has been the price action story for WTI Crude (CL) post-COVID. The key question now is: how far has the correction gone, and how far can it go? Using Elliott Wave theory, we provided answers for members of Elliottwave-Forecast on the price charts.
WTI Oil (CL) weekly chart – 07/27/2024
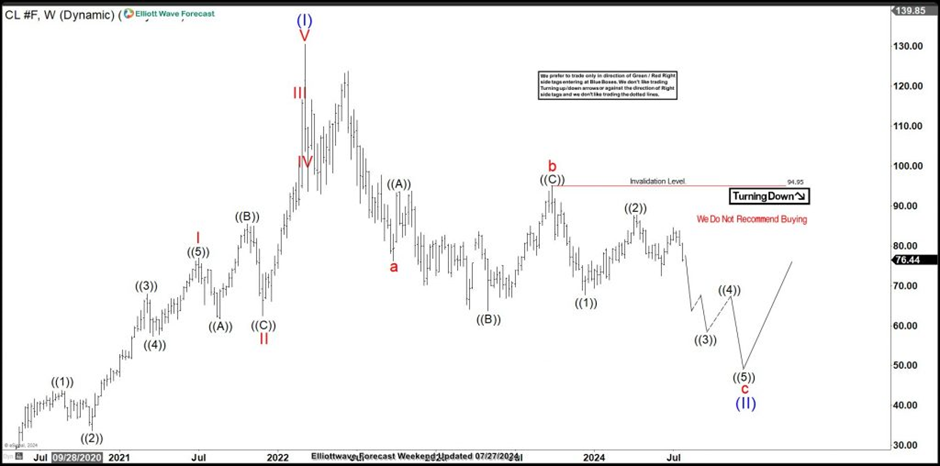
We shared the weekly chart above with members on 07/27/2024. This chart illustrates the commodity’s journey since COVID-19. The post-COVID impulse rally to the March 2022 high marked the supercycle degree wave (I). Since March 2022, prices have been correcting lower in supercycle wave (II). When we analyzed the sub-waves of (II), we examined the cycle degree waves within it. Cycle degree waves a and b of (II) completed in September 2022 and September 2023, respectively. From September 2023, cycle degree wave c of (II) began. Price already completed waves ((1)) and ((2)) of c and now favors the downside in wave ((3)). Within wave ((3)), price completed sub-waves (1) and (2), starting wave (3) of ((3)) in June 2024.
Thus, the current decline is wave (3) of ((3)), which could extend to at least $70 in the coming weeks. As long as the price remains below the June 2024 high of 84.57, our members understand why we favor staying on the sell-side. However, before looking for a SHORT opportunity, we would like to see the low of wave (1) breached. Afterward, we can sell bounces in 3, 7, or 11 swings.
WTI Oil (CL) one-hour chart – 07/27/2024
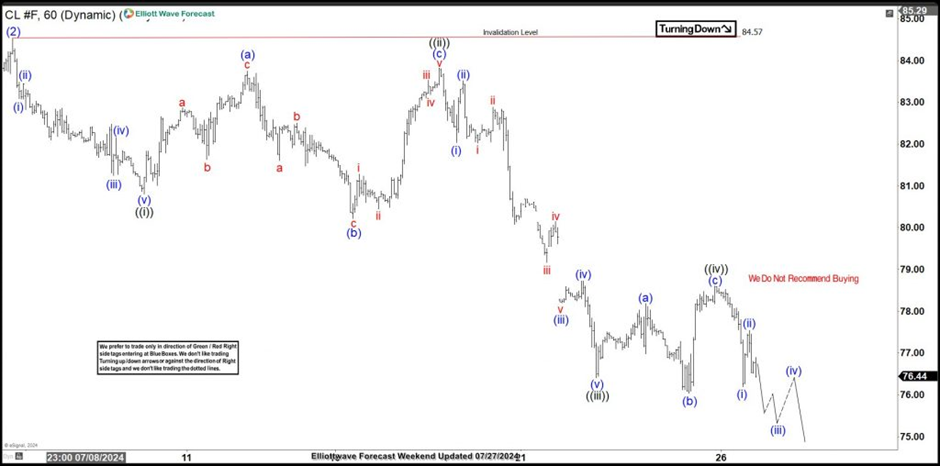
On 07/27/2024, we shared the H1 chart above along with the weekly chart to narrow down the shorter cycles for our members. On the H1 chart, we saw that the price was declining in wave 1 of (3). A closer look revealed wave ((v)) of 1 nearing completion. This indicates that a corrective bounce would soon begin. Two days later, wave 2 began as expected.
WTI Oil (CL) one-hour chart – 08/01/2024
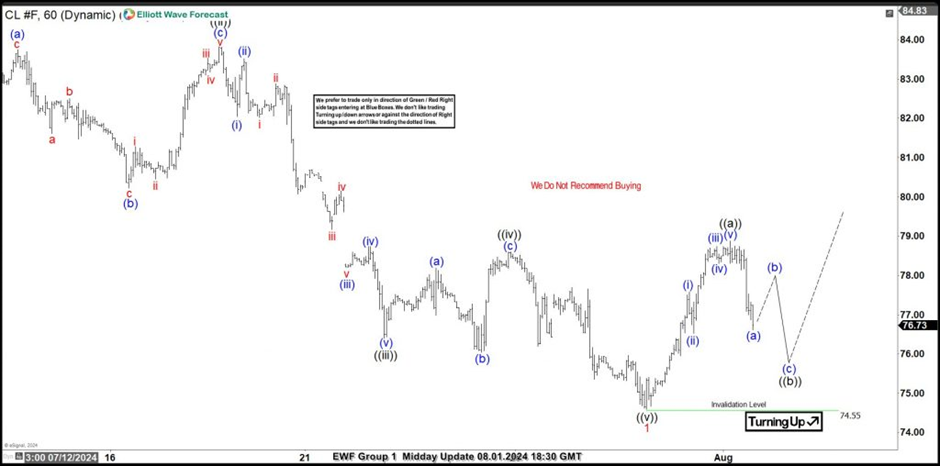
On 08/01/2024, we updated the shorter cycles for our members with the chart above. Wave 1 had finished, and wave 2 had begun. Currently, the price has completed wave ((a)) of 2 and is now in ((b)) of 2. Wave ((b)) should be corrective and form a 3- or 7-swing structure. If the current decline stays above 74.55, then one more leg higher should occur for ((c)) of 2. At the extreme of wave ((c)) of 2, the decline should resume unless a breach of 84.57 happens. Traders can look for SHORT opportunities from this extreme. We always highlight the extreme for our members and reveal opportunities with the blue box.
In summary, WTI favors the downside from the weekly chart to the hourly chart. The best way to trade this commodity is to sell from the extreme of corrective bounces. However, not all bounces should be traded in a bearish sequence. We share the best opportunities with the right side and blue box for our members.
Author

Elliott Wave Forecast Team
ElliottWave-Forecast.com


