|

Elliott Wave analysis: Dollar Index (DXY) completes correction, resumes downtrend [Video]

The short-term Elliott Wave analysis for the Dollar Index (DXY) indicates that the cycle from the January 13, 2025 high is unfolding as an impulse pattern, characterized by a five-wave structure moving in the direction of the larger trend. The decline from the January 13, 2025 high began with wave (1), which concluded at 106.96. This was followed by a corrective rally in wave (2), peaking at 109.88. The Index then resumed its downward trajectory in wave (3), reaching 97.92, before a corrective wave (4) rally ended at 101.99, as illustrated in the 1-hour chart below.

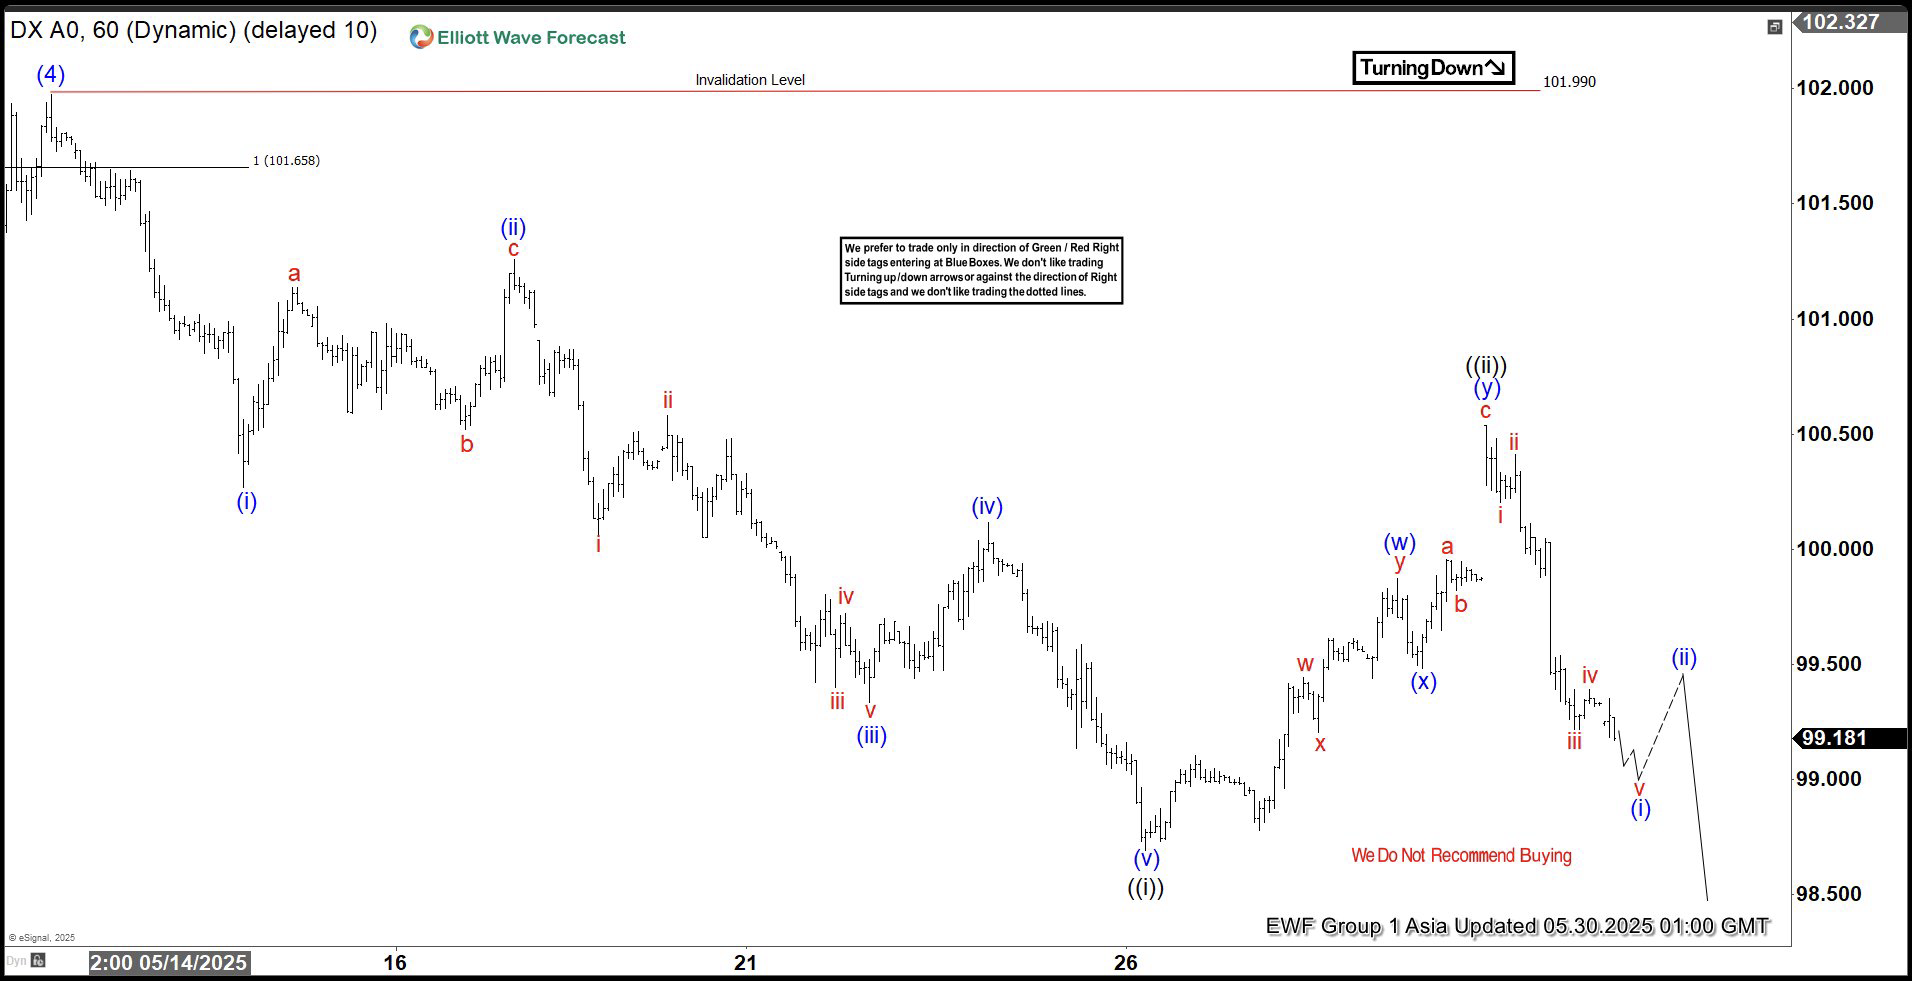
Currently, wave (5) is in progress, unfolding as another impulse in a lesser degree. From the wave (4) high, wave (i) concluded at 100.27, followed by a corrective wave (ii) rally ending at 101.259. The Index continued lower in wave (iii) to 99.33, with a subsequent wave (iv) rally peaking at 100.118. The final leg, wave (v), completed at 98.69, finalizing wave ((i)). The corrective wave ((ii)) unfolded as a double three Elliott Wave structure, with wave (w) reaching 99.87. Index then pullback in wave (x) to 99.48, before concluding wave (y) at 100.54. The Index has now turned lower in wave ((iii)). In the near term, as long as the pivot at 101.99 remains intact, the Dollar Index should extend its decline, potentially reaching new lows as the impulse wave continues.

Dollar Index (DXY) 60-Minute Elliott Wave Technical Chart


Author

Elliott Wave Forecast Team

Elliott Wave Forecast Team

ElliottWave-Forecast.com

More from Elliott Wave Forecast Team
Share:

Editor's Picks

EUR/USD flirts with daily highs, retargets 1.1900

EUR/USD regains upside traction, returning to the 1.1880 zone and refocusing its attention to the key 1.1900 barrier. The pair’s slight gains comes against the backdrop of a humble decline in the US Dollar as investors continue to assess the latest US CPI readings and the potential Fed’s rate path.

GBP/USD remains well bid around 1.3650

GBP/USD maintains its upside momentum in place, hovering around daily highs near 1.3650 and setting aside part of the recent three-day drop. Cable’s improved sentiment comes on the back of the Greenback’s  irresolute price action, while recent hawkish comments from the BoE’s Pill also collaborate with the uptick.

Gold clings to gains just above $5,000/oz

Gold is reclaiming part of the ground lost on Wednesday’s marked decline, as bargain-hunters keep piling up and lifting prices past the key $5,000 per troy ounce. The precious metal’s move higher is also underpinned by the slight pullback in the US Dollar and declining US Treasury yields across the curve.

Crypto Today: Bitcoin, Ethereum, XRP in choppy price action, weighed down by falling institutional interest 

Bitcoin's upside remains largely constrained amid weak technicals and declining institutional interest. Ethereum trades sideways above $1,900 support with the upside capped below $2,000 amid ETF outflows.

Week ahead – Data blitz, Fed Minutes and RBNZ decision in the spotlight

US GDP and PCE inflation are main highlights, plus the Fed minutes. UK and Japan have busy calendars too with focus on CPI. Flash PMIs for February will also be doing the rounds. RBNZ meets, is unlikely to follow RBA’s hawkish path.

Ripple Price Forecast: XRP potential bottom could be in sight

Ripple edges up above the intraday low of $1.35 at the time of writing on Friday amid mixed price actions across the crypto market. The remittance token failed to hold support at $1.40 the previous day, reflecting risk-off sentiment amid a decline in retail and institutional sentiment.