|

Elliott Wave Analysis: Calling The Double Correction In Russell

In this blog, I will show you some short-term Elliott Wave charts of Russell which we presented to our members in the past. Down below, you see the 1-hour updated chart presented to our clients on the 04/11/18 calling for more upside in a Double Elliott Wave correction in red W-X.

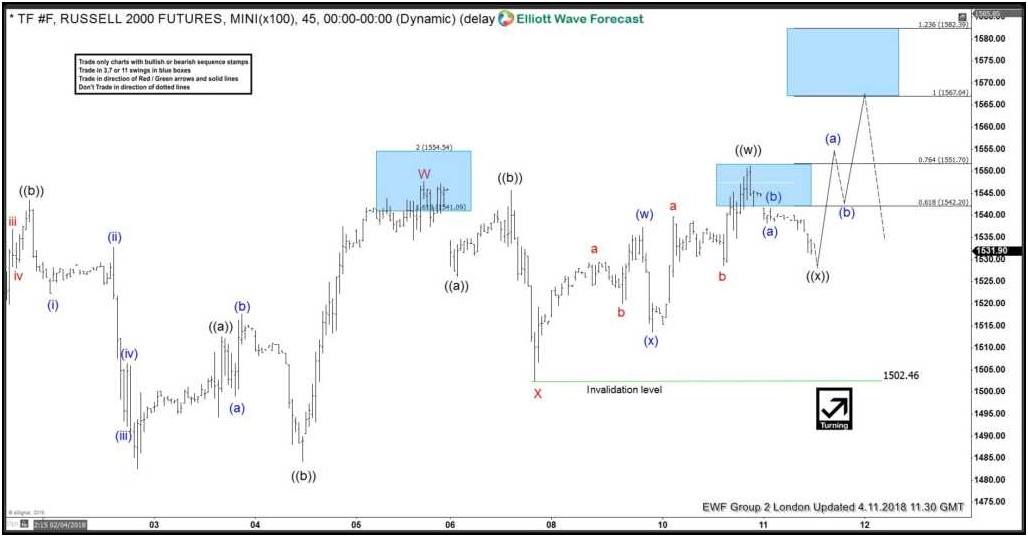
Russell ended the cycle from 03/13 peak, at around the areas of 1482 (04/02 low). Down from there, it started a recovery to the upside. The pullback can unfold either in 3-7 or 11 swings. After ending the cycle from 03/13 peak, the index started a recovery in red wave W-X.  We mentioned to our clients that the market should ideally end the correction from 04/02 low at the equal legs area of red W-X, which comes at around 1567.04+ areas. As it broke the red wave W 04/05 highs, the market opened up a short-term sequence from 04/02 low, confirming the next leg higher. However, short-term it corrected the cycle from 04/06 lows (1502.46) in black wave ((x)) first before the next move to the upside can be seen.

Russell 1 Hour Chart Elliott Wave Analysis

Elliot

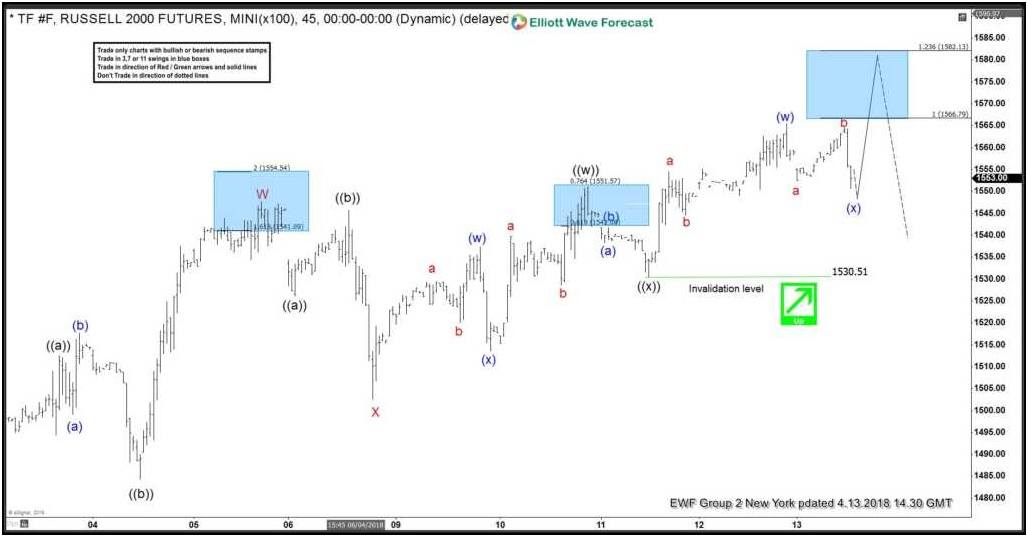
As I said in the paragraph above. Russell confirmed the next move higher due to the break above the highs of red wave W. In the last Elliott Wave chart, you can see that the instrument has ended black wave ((x)) and rallied nicely to the upside. You can see that the instrument has reached the equal legs at around 1567.04+ areas. Ideally, Russell corrects now the cycle from 04/02 lows at least in 3 waves. Either for new lows or another correction higher in 7 swings. That needs to be seen at this stage.

Russell 1 Hour Chart Elliott Wave Analysis

Elliot


Become a Successful Trader and Master Elliott Wave like a Pro. Start your Free 14 Day Trial at - Elliott Wave Forecast.

Author

Elliott Wave Forecast Team

Elliott Wave Forecast Team

ElliottWave-Forecast.com

More from Elliott Wave Forecast Team
Share:

Editor's Picks

EUR/USD: US Dollar to remain pressured until uncertainty fog dissipates

Unimpressive European Central Bank left monetary policy unchanged for the fifth consecutive meeting. The United States first-tier employment and inflation data is scheduled for the second week of February. EUR/USD battles to remain afloat above 1.1800, sellers moving to the sidelines.

GBP/USD reclaims 1.3600 and above

GBP/USD reverses two straight days of losses, surpassing the key 1.3600 yardstick on Friday. Cable’s rebound comes as the Greenback slips away from two-week highs in response to some profit-taking mood and speculation of Fed rate cuts. In addition, hawkish comments from the BoE’s Pill are also collaborating with the quid’s improvement.

Gold holds gains near $5,000 as China's gold buying drives demand

Gold price clings to the latest uptick near $5,000 in Asian trading on Monday. The precious metal holds its recovery amid a weaker US Dollar and rising demand from the Chinese central bank. The delayed release of the US employment report for January will be in the spotlight later this week.

Week ahead: US NFP and CPI data to shake Fed cut bets, Japan election looms

US NFP and CPI data awaited after Warsh’s nomination as Fed chief. Yen traders lock gaze on Sunday’s snap election. UK and Eurozone Q4 GDP data also on the agenda. China CPI and PPI could reveal more weakness in domestic demand.

Three scenarios for Japanese Yen ahead of snap election

The latest polls point to a dominant win for the ruling bloc at the upcoming Japanese snap election. The larger Sanae Takaichi’s mandate, the more investors fear faster implementation of tax cuts and spending plans. 

XRP rally extends as modest ETF inflows support recovery

Ripple is accelerating its recovery, trading above $1.36 at the time of writing on Friday, as investors adjust their positions following a turbulent week in the broader crypto market. The remittance token is up over 21% from its intraday low of $1.12.