Elliott Wave Analysis: Calling more Upside In JPM

In this blog, we will have a look at a past Elliott wave short-term structures of the JP Morgan Chase (JPM) Stock.
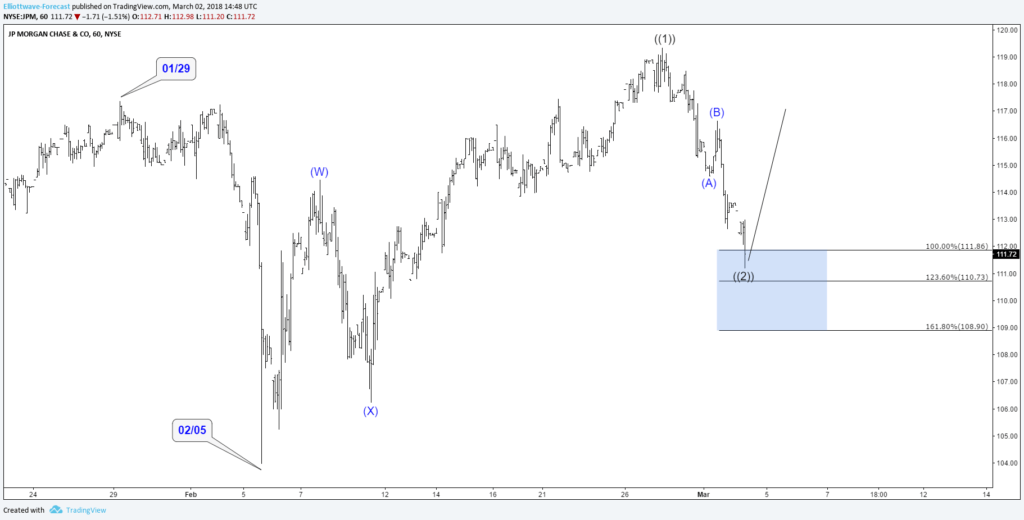
In the chart below, you can see the 1-hour chart presented to members in our Live Session Webinar on the 03/02/18.
We said to members that the JPM stock made a marginal new all-time high above 01/29/18. Therefore, we said that the right side remains to be the upside in 3-7-11 swings. However, we also mentioned in our Group 3 Live Session that the stock has ended the short-term cycle from 02/05/18 lows, in black ((1)) at the top of around $119.35.
And that the stock would correct that low in 3-7-11 swings. From the all-time top ($119.35) the stock corrected that cycle in blue wave (A)-(B)-(C). which is also known as a zig-zag Elliott wave structure. We mentioned to members that the stock can react and possiblly end black wave ((2)) at the equal legs area of $111.86-$108.90. Please keep in mind that we removed some labels to protect our client’s privileges.
JPM 03.02.2018 1 Hour Chart Elliott Wave Analysis
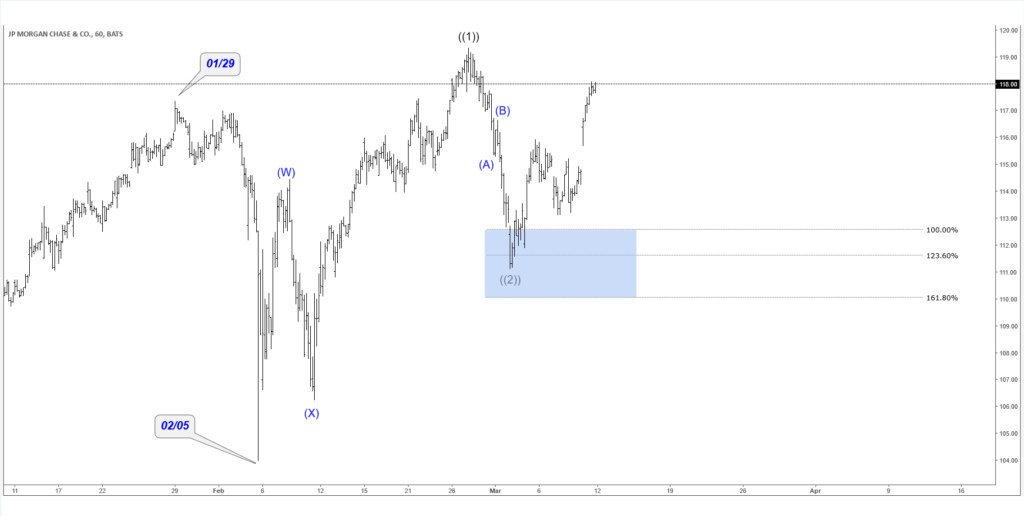
In the Elliott wave chart below, you can see that JPM rallied nicely from the mentioned equal legs area of around $111.86-$108.90. Our members took advantage of the Elliott wave analysis from above. And got a nice trade from the equal legs area to the upside. We are already risk-free on that trade. Which means we cant lose this trade anymore. Now, it needs to be seen whether we JPM can make new highs again. But the most important thing is that knowing the precise area where stock was expected to find buyers, allowed us to create a risk free position in the reaction higher. If you also want trading signals for stocks and ETFs, then please go ahead and start your 14 days FREE trial.
JPM 03.12.2018 1 Hour Chart Elliott Wave Analysis
Become a Successful Trader and Master Elliott Wave like a Pro. Start your Free 14 Day Trial at - Elliott Wave Forecast.
Author

Elliott Wave Forecast Team
ElliottWave-Forecast.com


