EEM emerging markets getting ready for a big move
EEM (The Emerging Market ETF) could be getting ready for a huge move higher. The ETF has been sideways since the peak in 2007. EEM looks weaker when compared to the rest of the World Indices because of its inability to break above the 2007 highs, whereas almost every indices have already broken above that high. While there is still a possibility to break lower below the (b) low at 11.2008, it is hard to forecast that path due to the constructive price action since the lows. Every dips that occurred have been bought after three waves pullback. The reaction afterwards also looks to be impulsive and strong. Therefore, we are expecting the upside to prevail and a break higher to happen soon.
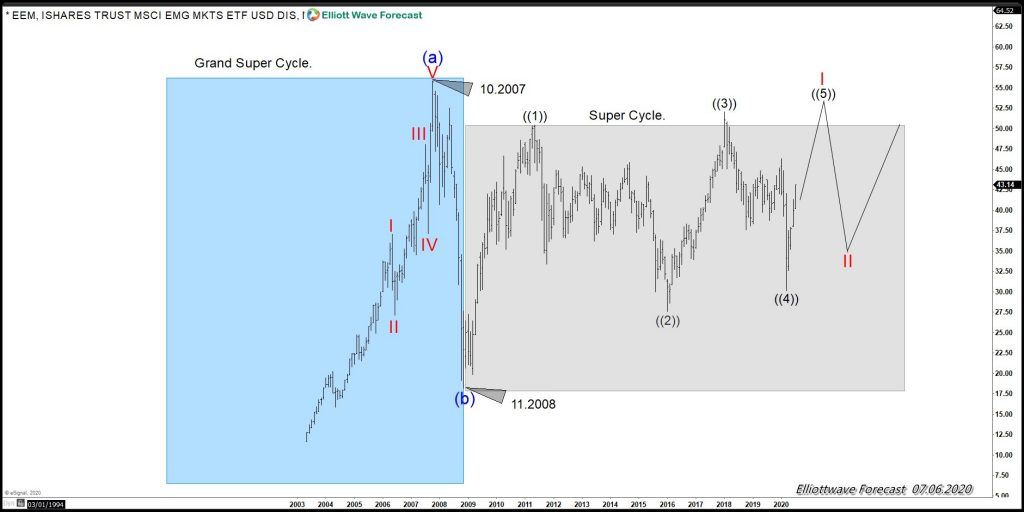
EEM Grand Super Cycle Elliott Wave Chart
The EEM Weekly chart above is divided into two important cycles. The Blue area represents the Grand Super Cycle, which has ended back in 2007. Meanwhile, the Gray Area represents the Super Cycle after the significant drop in 2008, which is in agreement with the whole World Indices correction in 2009. The structure from the 11.2008 lows can be labeled in three different ways. We will explain each scenario from the most likely to the least likely to happen.
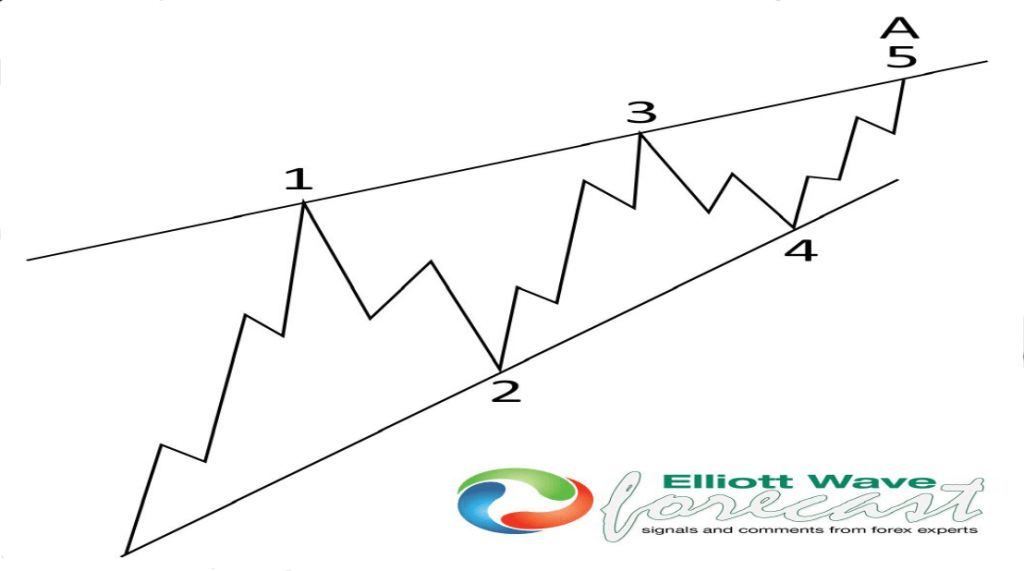
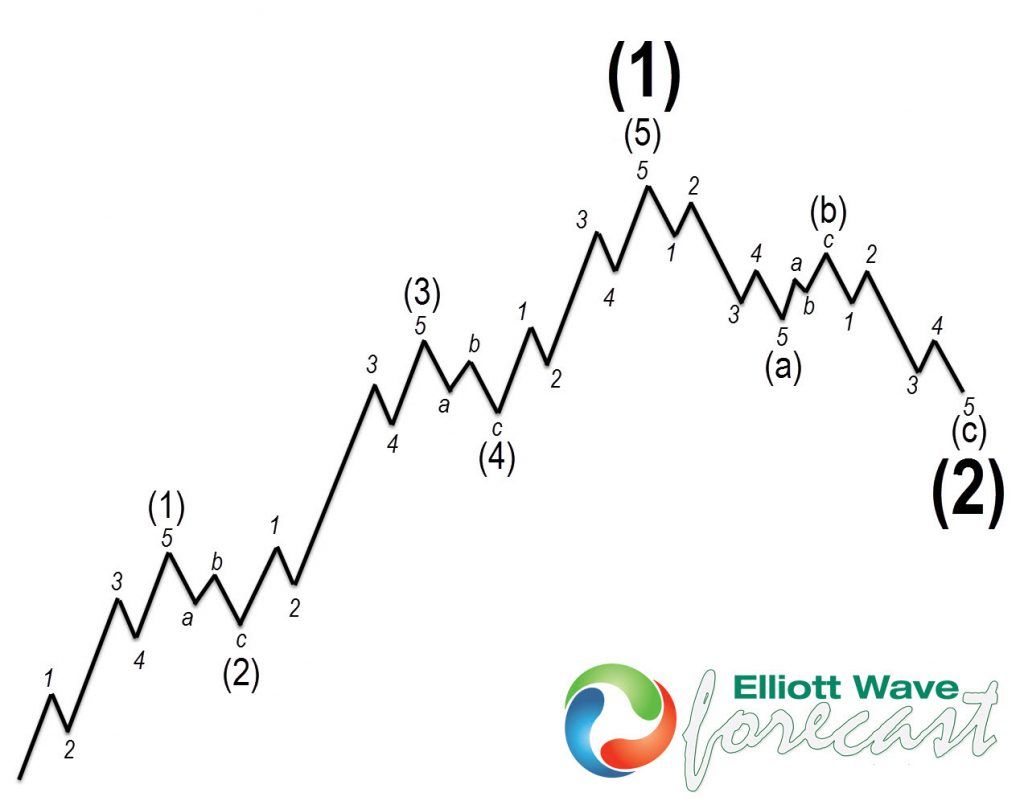
First scenario: A Leading Diagonal
A Leading Diagonal is a structure which happens most of the time coming off huge lows. The nature of this structure is a fight between buyers and sellers who still believe the Market will keep trading lower after the previous decline. A leading diagonal has an overlapping structure with sequences of 5-3-5-3-5, as shown in the following illustration.
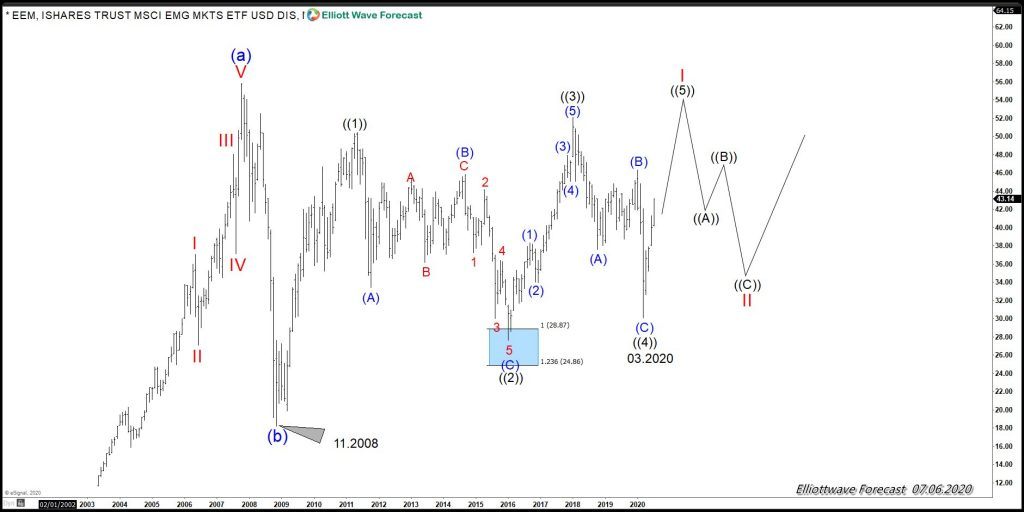
As we can see, the structure and sequences of a leading diagonal are similar when compared to the EEM Daily chart above. If this is the scenario unfolding, then the idea is for EEM to extend for another high and end the cycle from 11.2008 in wave I, followed by a big pullback in wave II. Afterwards, a rally higher in wave III, which will last for years to come, will happen.
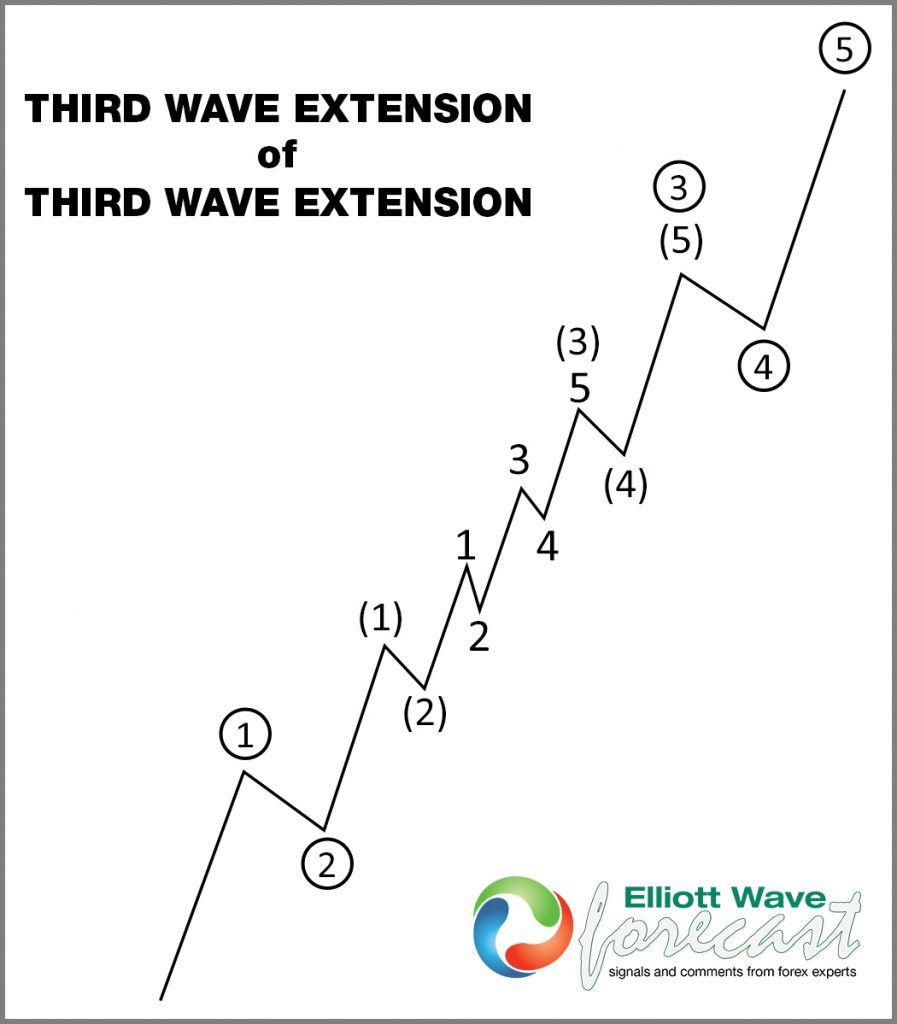
Second scenario: A Nest
A nest is a sequence of impulses that will produce a big move. Most of the time, this structure happens after a strong move against the trend. It is a representation of a fight between both sides, but with a clear defined price action in favor of one side. The sequences for this structure are 5-3-5-3-5 as shown below. The sequences of higher highs and higher lows usually are followed by a huge acceleration, which is most likely a wave III.
Third scenario: A WXY lower from 2007
A WXY is a structure that comes with a sequence of 3-3-3 as shown in the illustration below. This structure unfolds with an overlapping structure with no clear separation between the subdivisions. Most of the time the subdivision of this structure can be labeled as A-B-C for wave W, X, and Y. If this is the scenario unfolding, then the highs represented as wave ((3)) need to hold. Otherwise, this scenario will be invalidated.
At EWF, we understand the Market Nature. Therefore, we look at possible paths and find confirmations across other Market Instruments. That way, our members trade the right side and are consequently anticipating the Market, instead of reacting or chasing it.
Author

Elliott Wave Forecast Team
ElliottWave-Forecast.com


