Eco/Trade News Propels Markets
US Dollar: Dec USD is Up at 98.080.
Energies: Nov '19 Crude is Down at 56.29.
Financials: The Dec 30 year bond is Up 9 ticks and trading at 156.30.
Indices: The Dec S&P 500 emini ES contract is 14 ticks Lower and trading at 3082.50.
Gold: The Dec Gold contract is trading Up at 1467.00. Gold is 7 ticks Higher than its close.
Initial Conclusion
This is not a correlated market. The dollar is Up+ and Crude is Down- which is normal and the 30 year Bond is trading Higher. The Financials should always correlate with the US dollar such that if the dollar is lower then bonds should follow and vice-versa. The S&P is Lower and Crude is trading Lower which is not correlated. Gold is trading Higher which is not correlated with the US dollar trading Up. I tend to believe that Gold has an inverse relationship with the US Dollar as when the US Dollar is down, Gold tends to rise in value and vice-versa. Think of it as a seesaw, when one is up the other should be down. I point this out to you to make you aware that when we don't have a correlated market, it means something is wrong. As traders you need to be aware of this and proceed with your eyes wide open.
At this time Asia is trading Lower with the exception of the Aussie and Nikkei exchanges which are Higher. Currently all of Europe is trading Lower.
Possible Challenges To Traders Today
-
FOMC Member Williams Speaks at 8 AM EST. This is Major.
-
FOMC Member Brainard Speaks at 8:30 AM EST. This is Major.
-
Prelim UoM Consumer Sentiment is out at 10 AM EST. This is Major.
-
Prelim UoM Inflation Expectations is out at 10 AM EST. This is Major.
-
Final Wholesale Inventories m/m is out at 10 AM EST. This is Major.
Treasuries
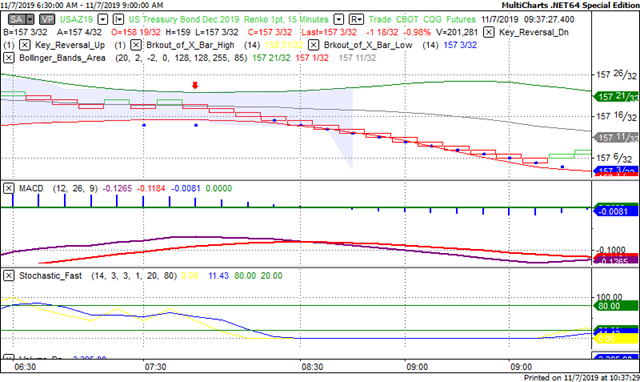
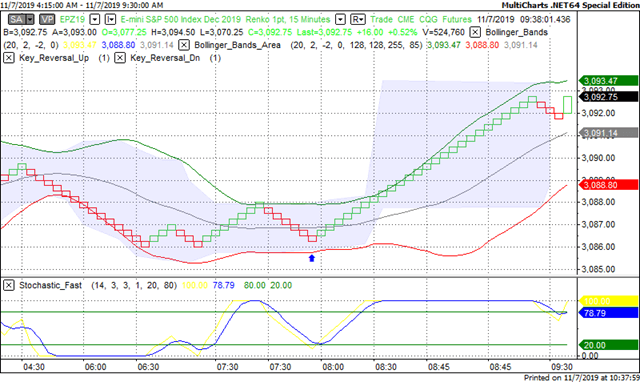
We've elected to switch gears a bit and show correlation between the 30 year bond (ZB) and The S&P futures contract. The S&P contract is the Standard and Poor's and the purpose is to show reverse correlation between the two instruments. Remember it's liken to a seesaw, when up goes up the other should go down and vice versa.
Yesterday the ZB made a major move at around 8 AM EST. The ZB hit a High at around that time and the S&P hit a Low. If you look at the charts below ZB gave a signal at around 8 AM EST and the S&P moved Higher at the same time. Look at the charts below and you'll see a pattern for both assets. ZB hit a High at around 8 AM and the S&P was moving Higher shortly thereafter. These charts represent the newest version of MultiCharts and I've changed the timeframe to a 15 minute chart to display better. This represented a long opportunity on the 30 year bond, as a trader you could have netted about 20 plus ticks per contract on this trade. Each tick is worth $31.25. Please note: the front month for the ZB is now December. The S&P contract is now at December as well and I've changed the format to Renko bars such that it may be more apparent and visible.
Charts Courtesy of MultiCharts built on an AMP platform
Bias
Yesterday we gave the markets an Upside bias as the USD, Bonds and Gold were all trading Lower and this reflects an Upside day. The markets didn't disappoint as the Dow gained 182 and the other indices gained ground as well. In fact the Dow and S&P hit record highs. Today we aren't dealing with a correlated market and our bias is to the Downside.
Could this change? Of Course. Remember anything can happen in a volatile market.
Commentary
Yesterday we had good economic news in the form of Unemployment Claims that went lower than expected (and that is good news) as well as Consumer Credit numbers that came in far less than expected and that is also good news. Another factor that had an effect on the markets was the news that both the US and China have agreed to cancel each other's countries tariffs in stages starting sometime in December. This was heralded as good news as well. Today we have preliminary numbers on both Consumer Sentiment and Inflation expectations, these are considered Major.
On Thursday, April 5th (of last year) we had the honor and privilege to be interviewed by David Lincoln on his You Tube channel. David is a floor trader for the options markets. If you listen to this interview, you will enjoy it.
Author

Nick Mastrandrea
Market Tea Leaves


