Eco News Doesn’t Impress Much

Good Morning Traders,
As of this writing 4 AM EST, here’s what we see:
US Dollar: Jun. USD is Down at 98.935.
Energies: May Crude is Up at 49.35.
Financials: The June 30 year bond is Down 1 tick and trading at 152.22.
Indices: The June S&P 500 emini ES contract is 4 tick Lower and trading at 2385.00.
Gold: The April gold contract is trading Up at 1266.60. Gold is 7 ticks Higher than its close.
Initial Conclusion
This is not a correlated market. The dollar is Down- and crude is Up+ which is normal but the 30 year bond is trading Lower. The Financials should always correlate with the US dollar such that if the dollar is lower then bonds should follow and vice-versa. The indices are Down- and Crude is trading Up+ which is correlated. Gold is trading Up+ which is correlated with the US dollar trading Down-. I tend to believe that Gold has an inverse relationship with the US Dollar as when the US Dollar is down, Gold tends to rise in value and vice-versa. Think of it as a seesaw, when one is up the other should be down. I point this out to you to make you aware that when we don’t have a correlated market, it means something is wrong. As traders you need to be aware of this and proceed with your eyes wide open.
At this hour Asia is trading mainly Lower with the exception of Shanghai and Singapore which are fractionally Higher. As of this writing Europe is trading mainly Lower with the exception of the Paris and Milan exchanges which are Higher at this hour..
Possible Challenges To Traders Today
– Advance GDP q/q is out at 8:30 AM. This is major.
– Advance GDP Price Index is out at 8:30 AM. This is major.
– Employment Cost Index is out at 8:30 AM EST. This is major.
– Chicago PMI is out at 9:45 AM EST. This is major.
– Revised UoM Consumer Sentiment is out at 10 AM. This is not major.
– Revised UoM Inflation Expectations is out at 10 AM EST. This is not major.
– FOMC Member Brainard Speaks at 1:15 PM EST. This is major.
– FOMC Member Harker Speaks at 2:30 PM EST. This is major.
Treasuries
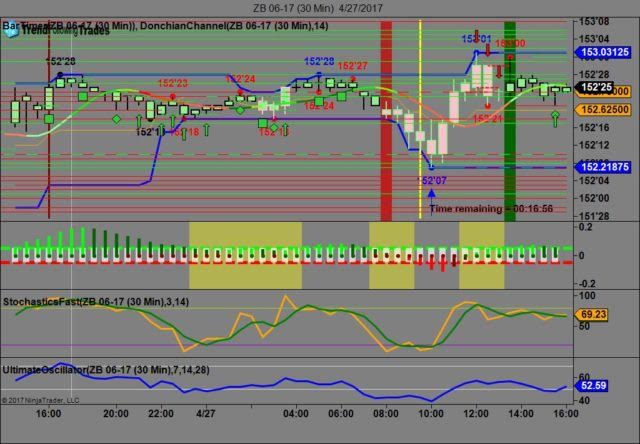
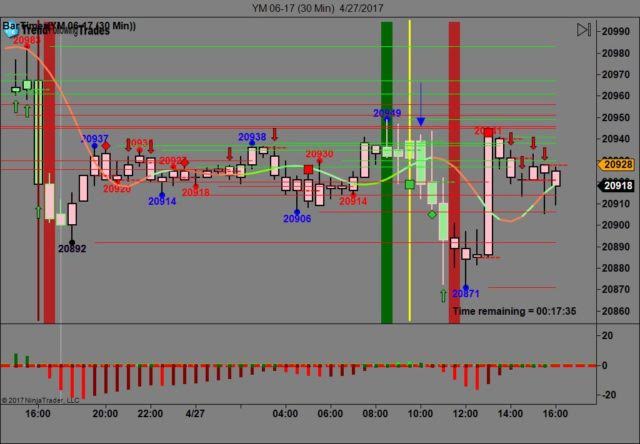
We’ve elected to switch gears a bit and show correlation between the 30 year bond (ZB) and The YM futures contract. The YM contract is the DJIA and the purpose is to show reverse correlation between the two instruments. Remember it’s liken to a seesaw, when up goes up the other should go down and vice versa.
Yesterday the ZB made it’s move at around 10 AM after the economic news was released. The ZB hit a low at around that time and the YM hit a high. If you look at the charts below ZB gave a signal at around 10 AM and the YM was moving lower at the same time. Look at the charts below and you’ll see a pattern for both assets. ZB hit a low at around 10 AM and the YM hit a high. These charts represent the newest version of Trend Following Trades and I’ve changed the timeframe to a 30 minute chart to display better. This represented a shorting opportunity on the 30 year bond, as a trader you could have netted about 20 plus ticks per contract on this trade. Each tick is worth $31.25. We added a Donchian Channel to the charts to show the signals more clearly.
Charts Courtesy of Trend Following Trades built on a NinjaTrader platform.
Bias
Yesterday we gave the markets a neutral bias as we didn’t see the indices moving with any conviction yesterday morning. A neutral bias means the markets could go in any direction but in this case the markets moved higher. The Dow gained 6 points and the other indices gained ground although fractionally. Today we aren’t dealing with a correlated and will maintain a neutral bias.
Could this change? Of Course. Remember anything can happen in a volatile market.
Commentary
Yesterday the markets were still mulling over Trump’s tax plan when a mini tsunami occurred in the form of economic news that wasn’t too stellar. Pending Homes Sales, Durable Goods, Core Durable Goods and even Unemployment Claims fell short of expectations. Whereas the markets did gain ground, it didn’t do so by much. The Dow only gained 6 points, the S&P 1 and the Nasdaq 24. Today we have Advanced GDP and Chicago PMI were are sure to be market movers and have the capacity to change market direction.
Author

Nick Mastrandrea
Market Tea Leaves


