Easter Monday doesn't help

USD: Jun '25 is Up at 98.205.
Energies: Jun '25 Crude is Up at 63.31.
Financials: The Jun '25 30 Year T-Bond is Lower by 1 ticks and trading at 113.00.
Indices: The Jun '25 S&P 500 emini ES contract is 193 ticks Higher and trading at 5233.00.
Gold: The Jun'25 Gold contract is trading Up at 3463.60
Initial conclusion
This is not a correlated market. The USD is Up and Crude is Up which is not normal, and the 30 Year T-Bond is trading Lower. The Financials should always correlate with the US dollar such that if the dollar is Higher, then the bonds should follow and vice-versa. The S&P is Higher and Crude is trading Higher which is not correlated. Gold is trading Higher which is not correlated with the US dollar trading Up. I tend to believe that Gold has an inverse relationship with the US Dollar as when the US Dollar is down, Gold tends to rise in value and vice-versa. Think of it as a seesaw, when one is up the other should be down. I point this out to you to make you aware that when we don't have a correlated market, it means something is wrong. As traders you need to be aware of this and proceed with your eyes wide open. Asia traded Higher with the exception of the Nikkei and Aussie exchanges. All of Europe is trading Lower with the exception of the London exchange which is fractionally Higher.
Possible challenges to Traders
-
FOMC Member Jefferson Speaks at 9 AM EST. This is Major.
-
FOMC Member Harker at 9:30 AM EST. This is Major.
-
Richmond Manufacturing Index is out at 10 AM EST. This is Major.
-
FOMC Member Kashkari Speaks at 1:40 PM EST. This is Major.
Traders, please note that we've changed the Bond instrument from the 10 Year (ZN) to the 2 Year (ZT). They work exactly the same.
We've elected to switch gears a bit and show correlation between the 2-year Treasury notes (ZT) and the S&P futures contract. The YM contract is the Dow Jones Industrial Average, and the purpose is to show reverse correlation between the two instruments. Remember it's likened to a seesaw, when up goes up the other should go down and vice versa.
Yesterday the ZT climbed Higher at around 8 AM EST with no news pending. The Dow slid Lower at the same time. Look at the charts below and you'll see a pattern for both assets. The Dow moved Lower at 8 AM EST and the ZT moved Higher at around the same time. These charts represent the newest version of Bar Charts, and I've changed the timeframe to a 15-minute chart to display better. This represented a Long opportunity on the 2-year note, as a trader you could have netted 30 plus ticks per contract on this trade. Each tick is worth $6.25. Please note: the front month for ZT is now Jun '25 and the Dow is Jun '25 as well. I've changed the format to filled Candlesticks (not hollow) such that it may be more apparent and visible.
Charts courtesy of BarCharts
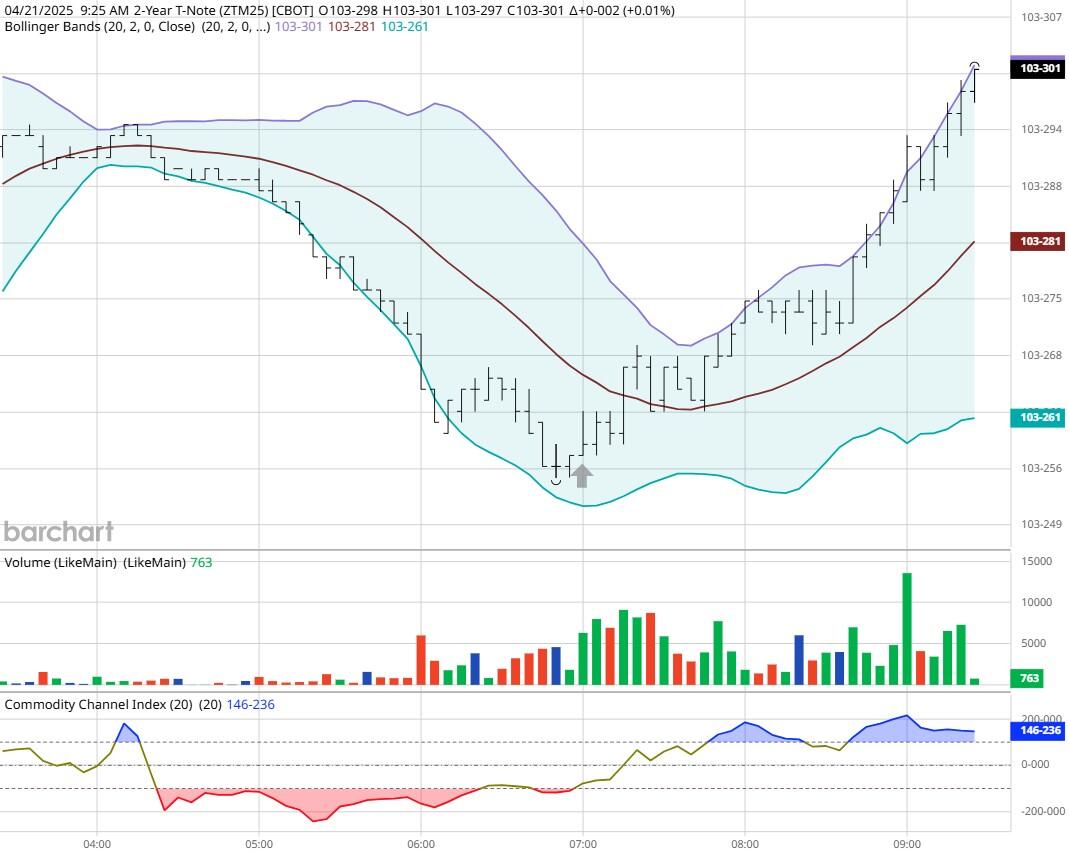
ZT -Jun 2025 - 4/21/25
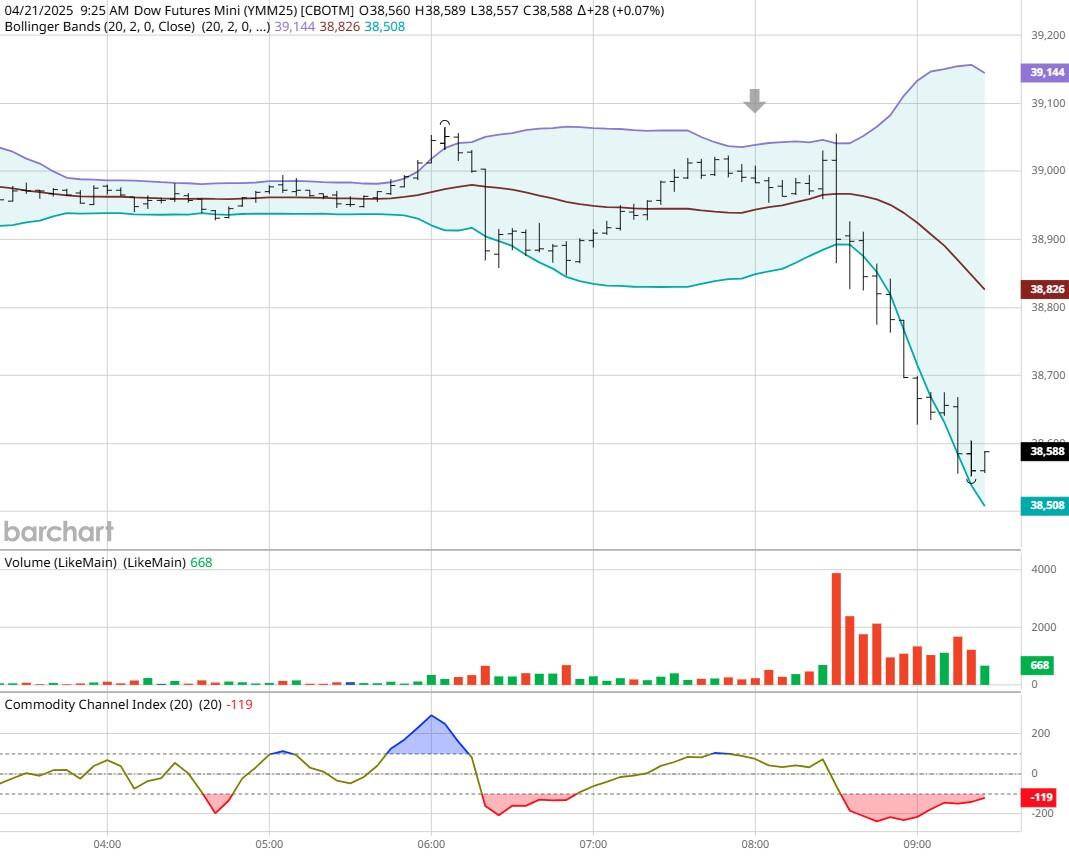
Dow - Mar 2025- 4/21/25
Bias
Yesterday we gave the markets a Neutral bias but the markets veered to the Downside from the Opening Bell onwards. The Dow dropped 972 points, and the other indices lost ground as well. Today we aren't dealing with a correlated market and our bias is Neutral.
Could this change? Of Course. Remember anything can happen in a volatile market.
Commentary
So, prior to the market open it was clear the indices were pointed Lower. I think a combination of many factors came into play. First it was the first trading day after a three day holiday and that is always volatile. Second, Pope Francis died overnight which put a sour mood on everything and lastly President Trump is still blasting Fed Chair Powell regarding lowering interest rates and that alone will make the markets nervous. Trump wants lower rates so he can tell American that he did that plus he thinks it will make the markets more forgiving on higher prices. I don't think that will work as I just came from Home Depot and was shocked at the higher prices I saw. Want to learn Market Correlation and determine market direction hours before the Opening Bell?
Author

Nick Mastrandrea
Market Tea Leaves


