Easter Monday doesn’t help

USD: Jun '24 is Down at 104.685.
Energies: Apr '24 Crude is Up at 85.07.
Financials: The June '24 30 Year T-Bond is Down 19 ticks and trading at 117.29.
Indices: The Jun '24 S&P 500 emini ES contract is 65 ticks Lower and trading at 5279.00.
Gold: The Apr'24 Gold contract is trading Up at 2278.30.
Initial conclusion
This is not a correlated market. The USD is Down and Crude is Up which is normal, and the 30 Year T-Bond is trading Lower. The Financials should always correlate with the US dollar such that if the dollar is Higher, then the bonds should follow and vice-versa. The S&P is Lower and Crude is trading Higher which is correlated. Gold is trading Higher which is correlated with the US dollar trading Down. I tend to believe that Gold has an inverse relationship with the US Dollar as when the US Dollar is down, Gold tends to rise in value and vice-versa. Think of it as a seesaw, when one is up the other should be down. I point this out to you to make you aware that when we don't have a correlated market, it means something is wrong. As traders you need to be aware of this and proceed with your eyes wide open. Asia is trading Higher with the exception of the Shanghai and Sensex exchanges which are Lower. Currently all of Europe is trading Mixed.
Possible challenges to traders
-
JOLTS Job Openings is out at 10 AM EST. This is Major.
-
Factory Orders m/m is out at 10 AM EST. This is Major.
-
FOMC Member Bowman Speaks at 10:10 AM EST. This is Major.
-
Wards Total Vehicle Sales - All Day by Brand. This is Major.
-
FOMC Member Williams Speaks at 12 noon. This is Major.
-
FOMC Member Mester Speaks at 12:05 PM EST. This is Major.
-
FOMC Member Daly Speaks at 1:30 PM EST. This is Major.
Treasuries
Traders, please note that we've changed the Bond instrument from the 30 year (ZB) to the 10 year (ZN). They work exactly the same.
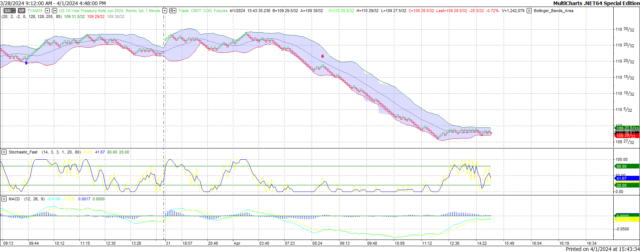
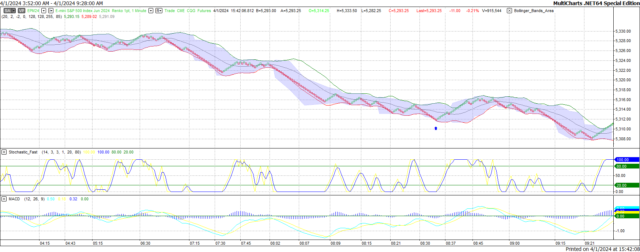
We've elected to switch gears a bit and show correlation between the 10-year bond (ZN) and the S&P futures contract. The S&P contract is the Standard and Poor's, and the purpose is to show reverse correlation between the two instruments. Remember it's likened to a seesaw, when up goes up the other should go down and vice versa.
Yesterday the ZN migrated Lower at around 8:45 AM EST as the S&P hit a Low at around the same time. If you look at the charts below the S&P gave a signal at around 8:45AM and the ZN started its Downward slide. Look at the charts below and you'll see a pattern for both assets. S&P hit a Low at around 8:45 AM and migrated Higher. These charts represent the newest version of MultiCharts and I've changed the timeframe to a 15-minute chart to display better. This represented a Short opportunity on the 10-year note, as a trader you could have netted about 30 plus ticks per contract on this trade. Each tick is worth $15.625. Please note: the front month for both the ZN and the S&P are now Jun '24. I've changed the format to filled Candlesticks (not hollow) such that it may be more apparent and visible.
Charts courtesy of MultiCharts built on an AMP platform
ZN -Jun 2024 - 04/01/24
S&P - Mar 2024 - 04/01/24
Bias
Yesterday we gave the markets a Neutral or Mixed bias as we didn't see much in the way of Market Correlation yesterday. The markets veered to the Downside despite a 3-day holiday weekend. The Dow dropped 241 points; the S&P dropped 11 but the Nasdaq eked out a meager gain of 17. Today we aren't dealing with a corelated market and our bias is Neutral.
Could this change? Of Course. Remember anything can happen in a volatile market.
Commentary
Ordinarily after a 3-day holiday weekend we usually see a spike in demand as traders are anxious to get back in the markets. That didn't happen this time around and I suspect the fact that yesterday was Easter Monday and in many parts of the world that is celebrated. The markets dropped yesterday with only the Nasdaq managing a 17-point gain. Today we have Jolts Job Openings which will dovetail nicely with Friday's Job report. We also have Factory Orders as well as Total Auto Sales for the month. Will this help to push the markets in the right direction? Only time will tell...
Author

Nick Mastrandrea
Market Tea Leaves
Nick Mastrandrea over 20 years experience in trading and formerly held a NASD Series 7. He currently holds a NJ Life, Health and Variable Authority. Nick is a published writer and his work has appeared in Futures Magazine, TraderPlanet and others.


