Earnings Season Begins

Good Morning Traders,
As of this writing 4 AM EST, here’s what we see:
US Dollar: Dec. USD is Down at 93.010.
Energies: Nov Crude is Up at 51.09.
Financials: The Dec 30 year bond is Down 6 ticks and trading at 152.10.
Indices: The Dec S&P 500 emini ES contract is 12 ticks Lower and trading at 2545.50.
Gold: The Dec gold contract is trading Down at 1291.80. Gold is 20 ticks Lower than its close.
Initial Conclusion
This is not a correlated market. The dollar is Down- and Crude is Up+ which is normal and the 30 year Bond is trading Lower. The Financials should always correlate with the US dollar such that if the dollar is lower then bonds should follow and vice-versa. The indices are Lower and Crude is trading Up+ which is correlated. Gold is trading Down which is not correlated with the US dollar trading Down-. I tend to believe that Gold has an inverse relationship with the US Dollar as when the US Dollar is down, Gold tends to rise in value and vice-versa. Think of it as a seesaw, when one is up the other should be down. I point this out to you to make you aware that when we don’t have a correlated market, it means something is wrong. As traders you need to be aware of this and proceed with your eyes wide open.
At this hour Asia is trading mainly Higher with the exception of the Singapore and Hang Seng exchanges which are trading Lower. As of this writing all of Europe is trading Mixed with half the exchanges Higher and the other half Lower.
Possible Challenges To Traders Today
JOLTS Job Openings is out at 10 AM EST. This is major.
10-y Bond Auction starts at 1 PM EST. This is major.
FOMC Meeting Minutes is out at 2 PM. This is major.
Treasuries
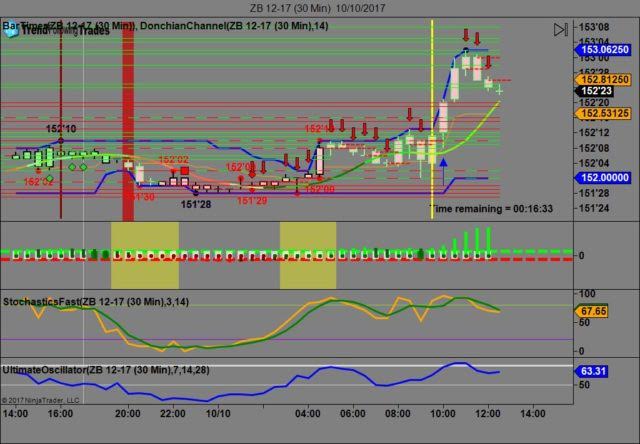
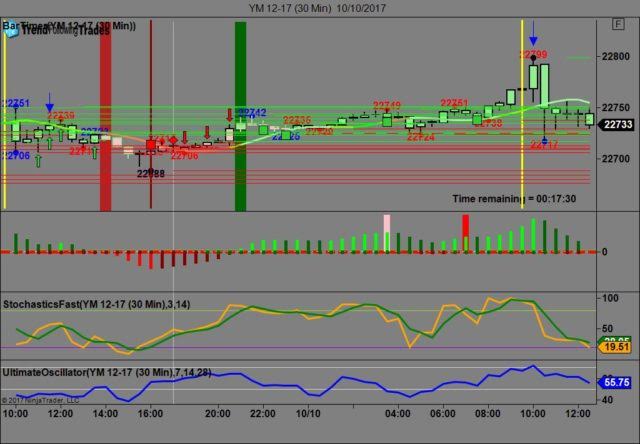
We’ve elected to switch gears a bit and show correlation between the 30 year bond (ZB) and The YM futures contract. The YM contract is the DJIA and the purpose is to show reverse correlation between the two instruments. Remember it’s liken to a seesaw, when up goes up the other should go down and vice versa.
Yesterday the ZB made it’s move at around 10 AM EST. The ZB hit a Low at around that time and the YM hit a High. If you look at the charts below ZB gave a signal at around 10 AM EST and the YM was moving Lower at the same time. Look at the charts below and you’ll see a pattern for both assets. ZB hit a Low at around 10 AM and the YM hit a High. These charts represent the newest version of Trend Following Trades and I’ve changed the timeframe to a 30 minute chart to display better. This represented a Long opportunity on the 30 year bond, as a trader you could have netted about 20 plus ticks per contract on this trade. Each tick is worth $31.25. We added a Donchian Channel to the charts to show the signals more clearly. Please note that the front month for the ZB and the YM contract is now December, 2017.
Charts Courtesy of Trend Following Trades built on a NinjaTrader platform.
Bias
Yesterday our bias was to the Upside as both the USD and the Bonds were trading lower yesterday morning and this usually bodes well for an upside day. The markets didn’t disappoint as the Dow gained 70 points and the other indices gained ground as well. Today we aren’t dealing with a correlated market and our bias is Neutral.
Could this change? Of Course. Remember anything can happen in a volatile market.
Commentary
This week commences Earnings Season for the 3rd calendar quarter, 2017. The question on everyone’s mind is what kind of an earnings season will it be? Retail Sales aren’t stellar and Amazon seems to be taking over the retail world as we know it. Retailers like Walmart and Lowe’s are trying to figure out what to do to combat the Amazon tsunami, so time will tell how they make out in that endeavor. One would think that geopolitical news and events would keep the markets at bay but nothing of the sort is happening; in fact the markets are moving higher. It seems that none of the pundits and analysts can figure this out. From our point of view we’ll keep analyzing the markets on a daily basis and use our rules of Market Correlation to determine direction.
Author

Nick Mastrandrea
Market Tea Leaves


