-
The US Dollar Index is breaking a bear flag
-
Possible massive head and shoulder on the daily
The DXY (US Dollar Index) has been moving up slowly in a bear flag for about 20 days now. and we have been waiting for a clear break for what seems to be a test of a major support zone.
Let´s have a look at the daily chart:
The big support zone is that 99.0 - 99.5 zone where price gapped up and has been tested strongly twice already. Needles to say that buyers are heavily positioned here with short term sellers also taking profit at these levels.
If price completes this bear flag brak we could have a monster head and shoulders patter in our hands with this big support zone as the neckline.
Let´s zoom in on that flag now:
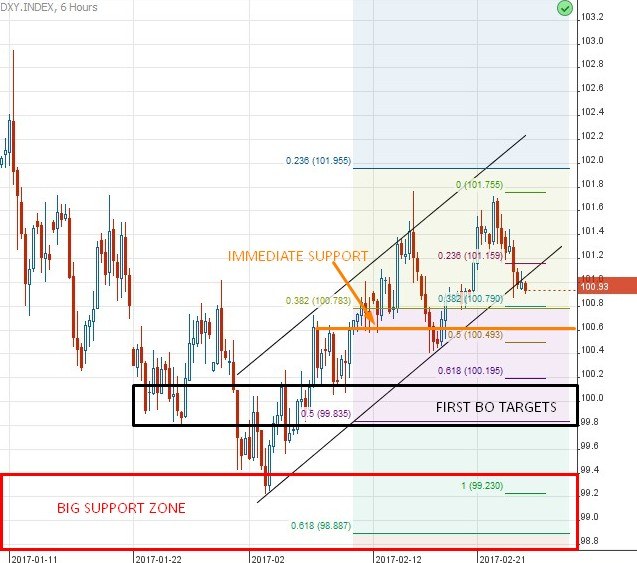
First if you look at the fibos from the 99.5-103.5 action (up move) the 50% comes at 99.8 which confluences with the 76.4% of the flag action. Big level in play once this pattern breaks.
But the immediate support would come at the 50% retracement of the flag around the 100.6 level which is a previous base / resistance zone. Momo traders are going to take profit here so watch it closely if/when we get there.
Our advice is for you to look for long opportunities in the EUR/USD (given that 1.0500 rejection) and short opportunities un the USD/JPY if the scenario plays out.
Information on the Learn2.trade website and inside our Telegram Group is intended for educational purposes and is not to be construed as investment advice. Trading the financial markets carries a high level of risk and may not be suitable for all investors. Before trading, you should carefully consider your investment objectives, experience, and risk appetite. Only trade with money you are prepared to lose. Like any investment, there is a possibility that you could sustain losses of some or all of your investment whilst trading. You should seek independent advice before trading if you have any doubts. Past performance in the markets is not a reliable indicator of future performance. Learn2.trade takes no responsibility for loss incurred as a result of the content provided inside our Telegram Groups. By signing up as a member you acknowledge that we are not providing financial advice and that you are making the decision on the trades you place in the markets. We have no knowledge of the level of money you are trading with or the level of risk you are taking with each trade.
Recommended Content
Editors’ Picks
EUR/USD trades weak below 1.0800 amid Good Friday lull, ahead of US PCE
EUR/USD remains depressed below 1.0800 after soft French inflation data, amid minimal volatility and thin liquidity on Good Friday. The pair keenly awaits the US PCE inflation data and Fed Chair Powell's speech for fresh hints on next week's price action.
GBP/USD holds steady above 1.2600 as markets stay calm on Good Friday
GBP/USD trades sideways above 1.2600 amid a typical Good Friday trading lull. A broadly firmer US Dollar could keep any upside attempts limited in the pair ahead of the US PCE inflation data and Fed Chair Powell's appearance.
Gold price sits at all-time highs above $2,230, US PCE eyed
Gold price hit all-time highs at $2,236 on Thursday to finish Q1 2024 with a bang. Most major world markets, including the US are closed due to Holy Friday, leaving volatility around Gold price highly subdued. US PCE inflation and Powell are awaited.
Jito price could hit $6 as JTO coils up inside this bullish pattern
Jito (JTO) price has been on an uptrend since forming a local bottom in early January. Since then, JTO has revisited the key swing point formed in early December, suggesting the bulls’ intention to move higher.
Key events in developed markets next week
Next week, the main focus will be inflation and the labour market in the Eurozone. We expect services inflation to be impacted by the easter effect, while the unemployment rate to be unchanged.